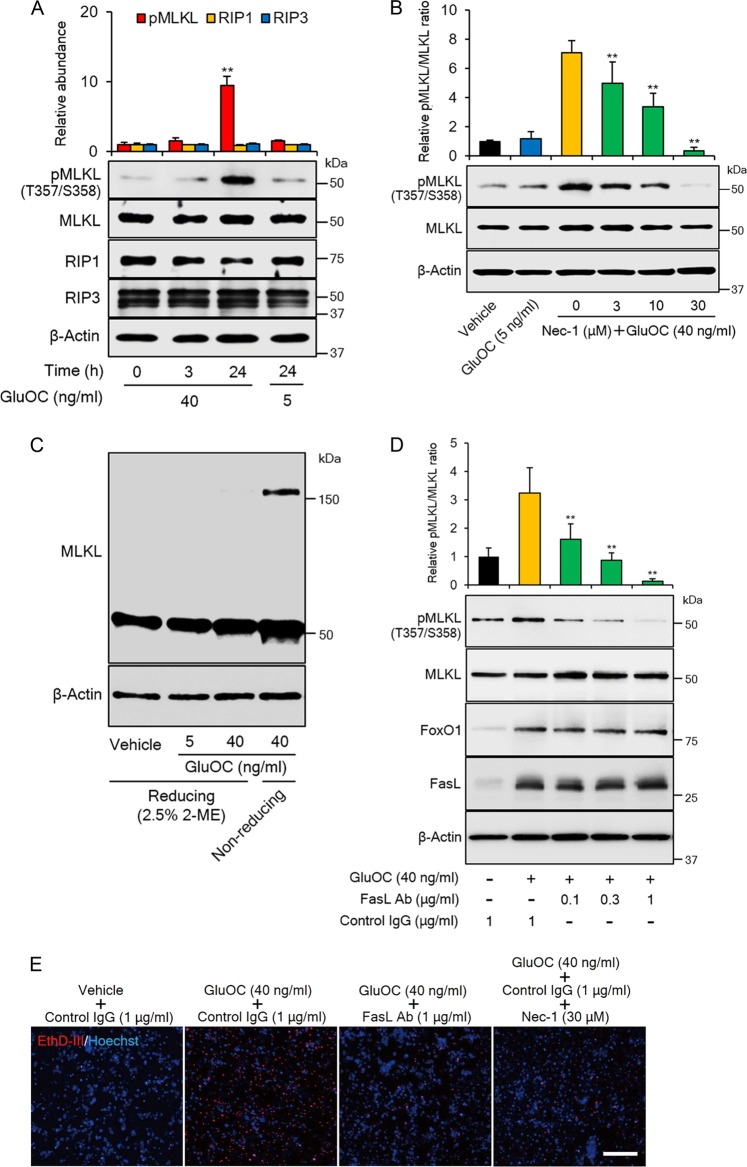
Fig. 5. MLKL phosphorylation and trimerization in 3T3-L1 adipocytes induced by high-dose GluOC in a manner dependent on FasL-Fas signaling.
a Immunoblot analysis of total and phosphorylated (Thr357/Ser358) forms of MLKL, as well as of RIP1 and RIP3 in 3T3-L1 adipocytes incubated with GluOC (5 or 40 ng/ml) for 3 or 24 h. A representative blot, as well as quantitative data (means + SEM, normalized by the amount of total MLKL or of β-actin) from four independent experiments are shown. **p < 0.01 versus the corresponding value for control (time 0) cells (two-way ANOVA followed by the Tukey–Kramer HSD test). b Immunoblot analysis of MLKL phosphorylation in 3T3-L1 adipocytes incubated first in the absence or presence of the indicated concentrations of necrostatin-1 (Nec-1) for 1 h and then in the additional absence or presence of GluOC (5 or 40 ng/ml) for 24 h. A representative blot and quantitative data (means + SEM) from three independent experiments are shown. **p < 0.01 versus the value for cells exposed to GluOC (40 ng/ml) alone (two-way ANOVA followed by the Tukey–Kramer HSD test). c Cells were incubated with the indicated concentrations of GluOC for 24 h, after which cell lysates were prepared in the absence or presence of 2.5% 2-mercaptoethanol (2-ME) and then subjected to immunoblot analysis with antibodies to MLKL. The data are representative of three independent experiments. d Cells were incubated first in the absence or presence of the indicated concentrations of neutralizing antibodies (Ab) to FasL or of control immunoglobulin G (IgG) for 6 h and then in the additional absence or presence of GluOC (40 ng/ml) for 12 h. Cell lysates were then subjected to immunoblot analysis of MLKL phosphorylation as well as of FoxO1 and FasL. A representative blot, as well as quantitative data (means + SEM) from three independent experiments are shown. **p < 0.01 versus the value for cells exposed to GluOC in the presence of control IgG (two-way ANOVA followed by the Tukey–Kramer HSD test). e Cells were incubated first in the absence or presence of neutralizing antibodies to FasL (1 µg/ml), control IgG (1 µg/ml), or necrostatin-1 (30 µM) for 6 h and then in the additional absence or presence of GluOC (40 ng/ml) for 48 h. They were then stained with Hoechst 33342 (blue) and EthD-III (red) and observed with a fluorescence microscope. The images are representative of three independent experiments. Scale bar, 200 µm

