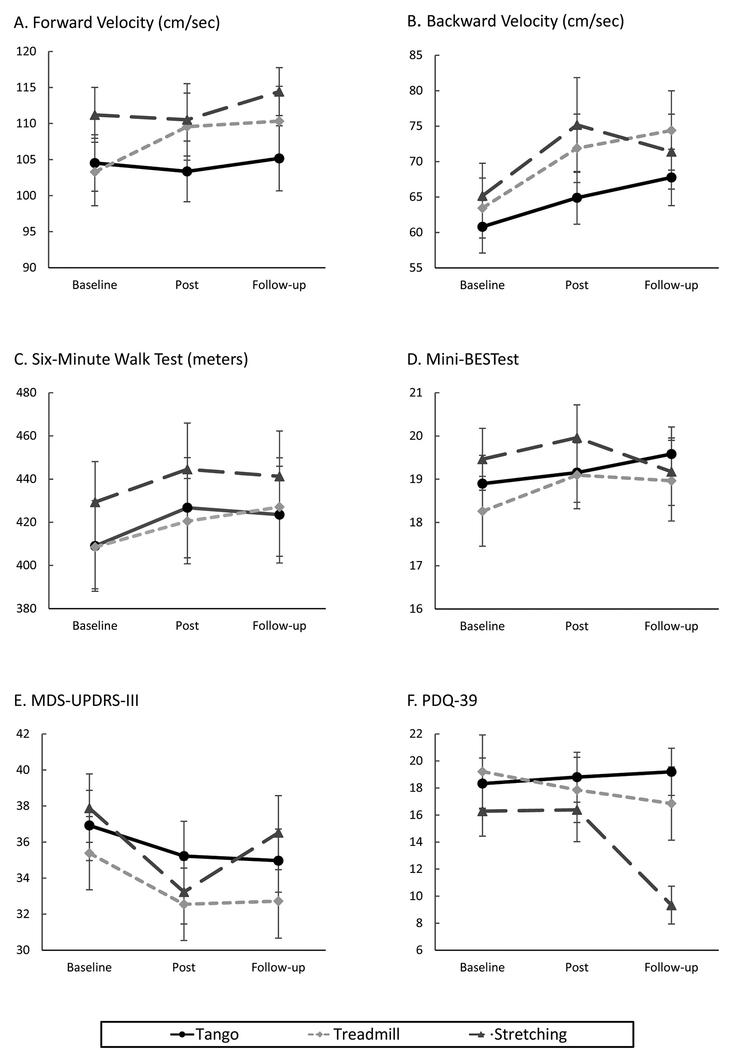
Figure 2.
Means and standard errors for tango, treadmill, and stretching groups at baseline, post-test (after 12 week intervention), and follow-up (12 weeks after post-test). Estimates of significance from simple differences of group by time least square means generated from the generalized estimating equation models (also see Supplemental Digital Content 3).
A. Forward velocity: Significant improvements for treadmill group between baseline and post-test (p = 0.0007). B. Backward velocity: Significant improvement for treadmill group between baseline and post-test (p < 0.0001) and baseline and follow-up (p = 0.0002). Significant improvement for stretching group between baseline and post-test (p = 0.0047). C. SMWT: A trend towards improvement for tango between baseline and post-test (p = 0.026). Participants in the tango group significantly declined between post-test and follow-up (p = 0.0043). D. Mini-BESTest: No significant effects. E. MDS-UPDRS-III: Significant improvement between baseline and post-test for the stretching group (p = 0.0004). F. PDQ-39: Significant improvement for stretching group between post-test and follow-up (p = 0.0002).

