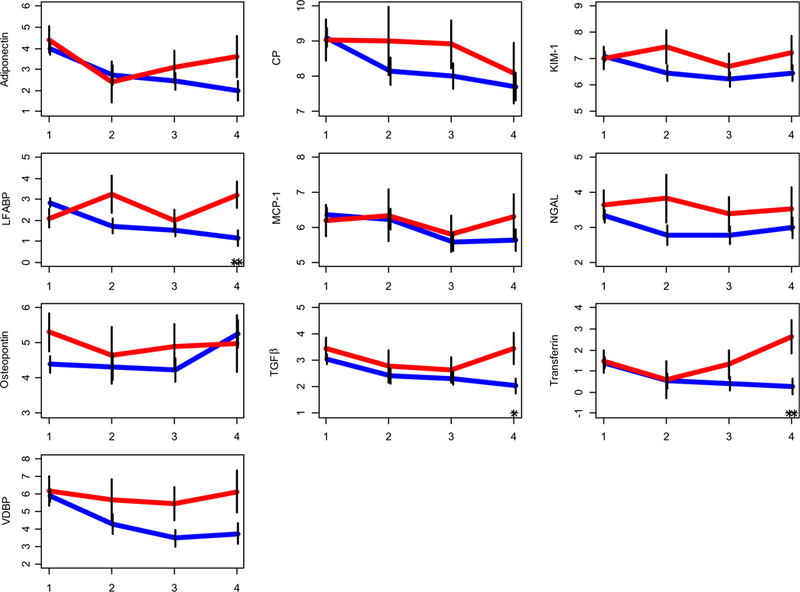
Fig. 2.

Individual urinary biomarker based prediction for renal function decline. Mean (standard error bars) value levels of unadjusted urine biomarkers starting at the time of biopsy in patients (n = 14) with renal functional decline in red and others in blue. (y axis), at 0 to 3, 3 to 6, 6 to 9, and 9 to 12 month time points (x axis), respectively. Please see Fig. 2 for further details. The symbols “*” and “**” reflect statistically significant differences between the groups, at p <0.05, and <0.01, respectively. Biomarker levels starting from visit 1 (baseline, time of biopsy) and then every 3 months up to month 12 (or visit 4) are shown for each of the 10 biomarkers considered in this study Biomarker levels remain higher for patients with renal functional decline (red) as compared to those with preserved renal function (blue). Although similar at visit 1, level of TGFβ, transferrin, andLFABP is significantly lower at month 12 (visit 4) in patient with preserved renal function. VDBP, vitamin-D binding protein; LFABP, fatty acid-binding protein
