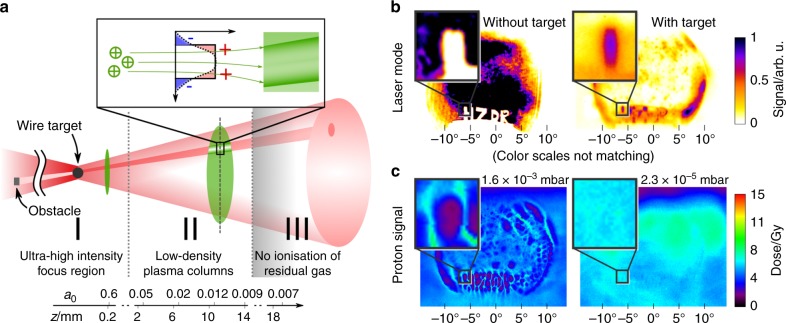
Fig. 2.
Imprint scheme and experimental imprinting results. a Schematic depiction of the imprint scenario, visualizing the transmitted laser path (red cone) and the accelerated proton bunch (green) along the propagation axis z. Between target and proton beam diagnostic, three main regions are identified and related to the transmitted laser intensity expressed via a0. Spatial filtering in the laser focus results in the emphasis of high spatial laser frequencies, for example those related to obstacles inserted in the beam before focusing. In areas of sufficient transmitted laser intensity, residual gas molecules are ionized locally and low-density plasma columns extending along z are formed until the laser intensity has dropped below the ionization threshold. In the quasi-neutral region II, transverse quasi-static electric fields between the plasma electrons and the remaining fixed ions are visualized via radiography with the accelerated protons as intrinsic probe. b Transmitted laser intensity mode without (left) and with (right) a 10 μm diameter tungsten wire positioned in the laser focus. The color scale for each picture was adjusted to ensure visibility of important features. c Proton beam profile (4.7 MeV layer displayed) at two different residual gas pressures in the experimental chamber. In the left image, structures corresponding to the obstacles inserted in the laser beam can be observed, as well as features originating from fluctuations intrinsic to the laser beam profile. By decreasing the pressure the imprint effect can be switched off almost completely (right image). The change in overall dose between both cases is within the range of shot-to-shot variations of the proton acceleration performance

