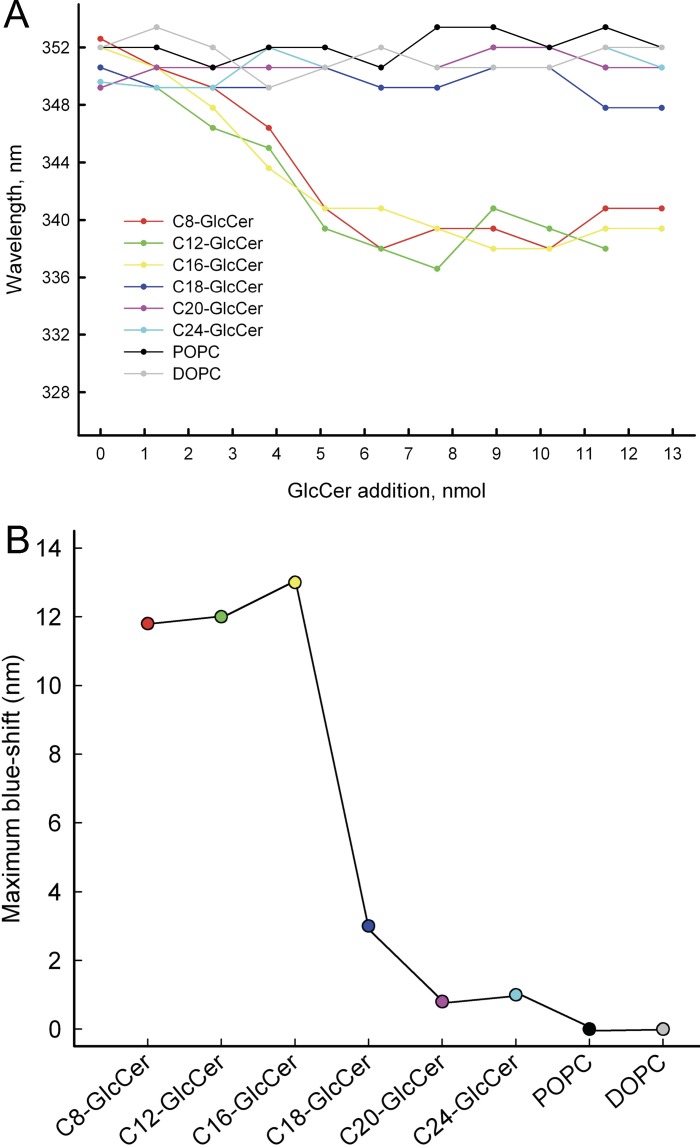
Fig 5. Changes in GLTP Trp emission maxima versus GlcCer concentration.
(A) Trp emission maxima versus increasing amounts of GlcCer. (B) C8:0-GlcCer, C12:0-GlcCer, and C16:0-GlcCer created blueshifts between 12 and 13 nm, whereas the longer GlcCers, as well as POPC and DOPC, showed no significant blueshifts. The data are from at least three different experiments.

