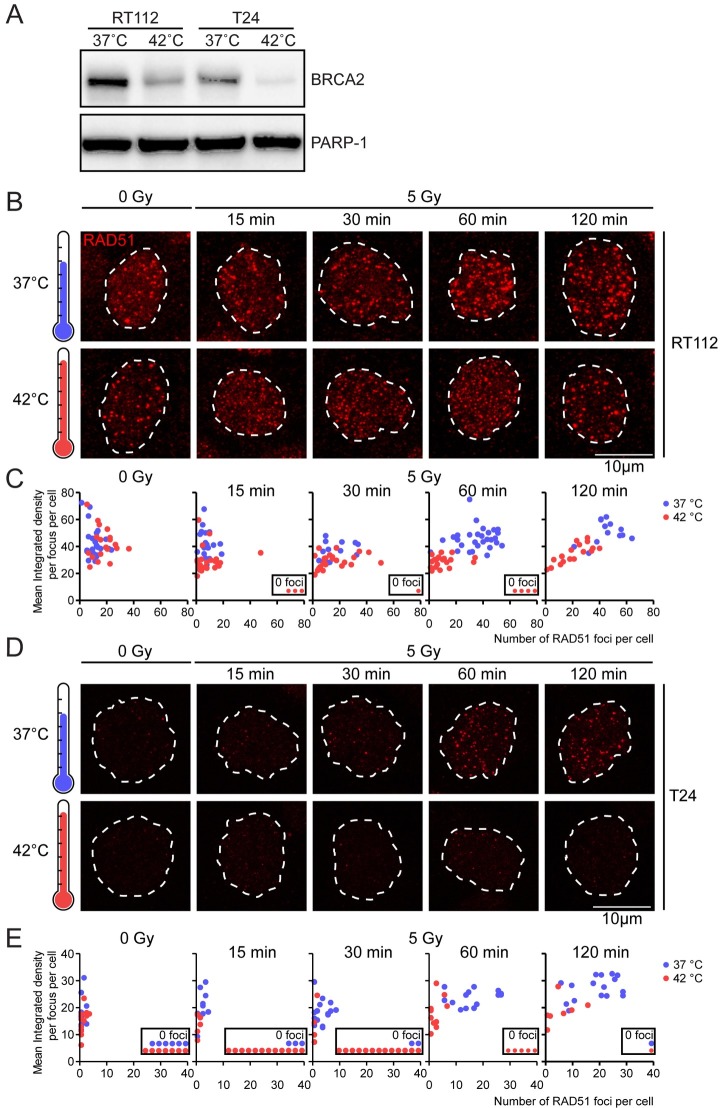
Fig 3. Hyperthermia induces distinct changes in RAD51 foci in RT112 and T24 cell lines.
A) Immunoblots of samples treated with or without hyperthermia, probed for BRCA2 and PARP-1 as a loading control. B) RT112 cells were treated with or without hyperthermia and subsequently irradiated with the indicated dose. Cells were then incubated at 37°C, and fixed at indicated time-points afterward irradiation. EdU was present for one hour prior to fixation to identify S phase cells. Cells were stained for EdU and RAD51. Pictures are a maximum projection of a Z-stack, and the dotted lines denote the perimeter of EdU-positive nuclei. C) The 2-dimensional graph expresses a quantified classification of RAD51 foci. Each dot in the graph represents one cell, plotted based on the number of RAD51 foci in its nucleus (y axis) and their integrated density (x axis); a derivate of intensity and area per nucleus. Cells without foci are presented in the embedded figure noting ‘0 foci’. D) and E) As panel B and C, but for T24 cells.

