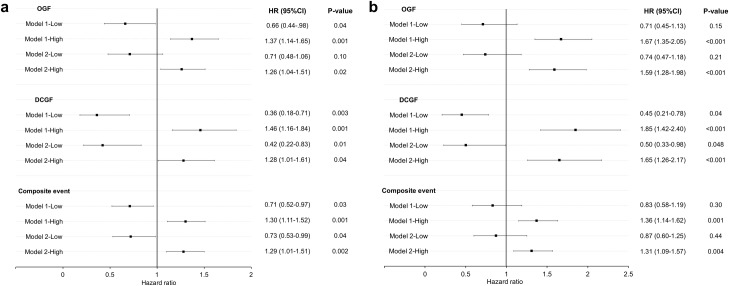
Fig 3. Forest plots of the Cox proportional hazards models for graft outcomes.
Adjusted hazard ratio estimates and 95% confidence intervals for overall graft failure (OGF), death-censored graft failure (DCGF), and composite event are displayed according to the mean serum uric acid (UA) level within the first year (a) and 1–5 years (b) after transplantation. Covariates used in model 1 were as follows: transplant era, age, sex, body mass index, donor type, donor age, donor sex, pre-transplant diabetes mellitus, duration of pre-transplant dialysis, retransplantation, number of human leukocyte antigen mismatches, tacrolimus use, delayed graft function, biopsy-proven acute rejection within 1 year, systolic/diastolic blood pressure at 1 month, and eGFR at 1 month after kidney transplantation. Covariates used in model 2 included those used in model 1, with eGFR at 1 year after kidney transplantation rather than at 1 month. The composite event represents the sum of return to dialysis, retransplantation, death from graft dysfunction, and eGFR decline of more than 40% from the baseline level, which was measured at 1 year or 5 years after transplantation (for the 1-YR and 5-YR analyses, respectively). HR, hazard ratio; CI, confidence interval; eGFR, estimated glomerular filtration rate.

