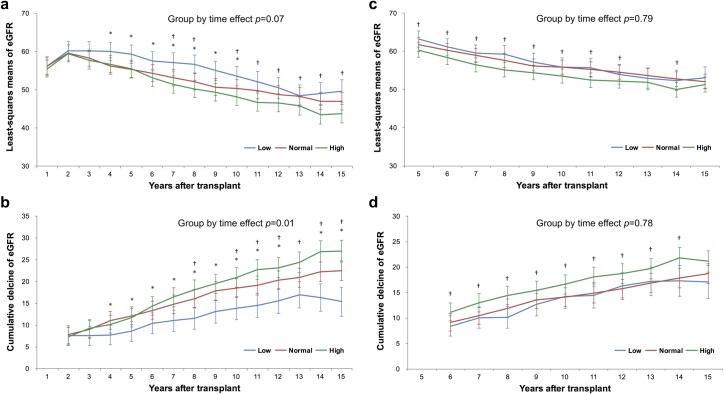
Fig 4. Comparisons of eGFR decline using linear mixed models.
Differences in eGFR decline from the baseline level (eGFR at 1 year after transplantation) according to the mean serum uric acid (UA) level within the first year after transplantation (1-YR analysis) are shown in (a) and (b). Differences in eGFR decline from the baseline level (eGFR at 5 years after transplantation) according to the mean serum UA level within 1–5 years after transplantation (5-YR analysis) are shown in (c) and (d). The eGFR and eGFR decline are presented as least-squares means, adjusting for all covariates (including the baseline eGFR) using linear mixed models. P-values for the group-by-time interaction effect were calculated. *: P<0.05, low-UA group versus normal-UA group, †: P<0.05, high-UA group versus normal-UA group. eGFR, estimated glomerular filtration rate.

