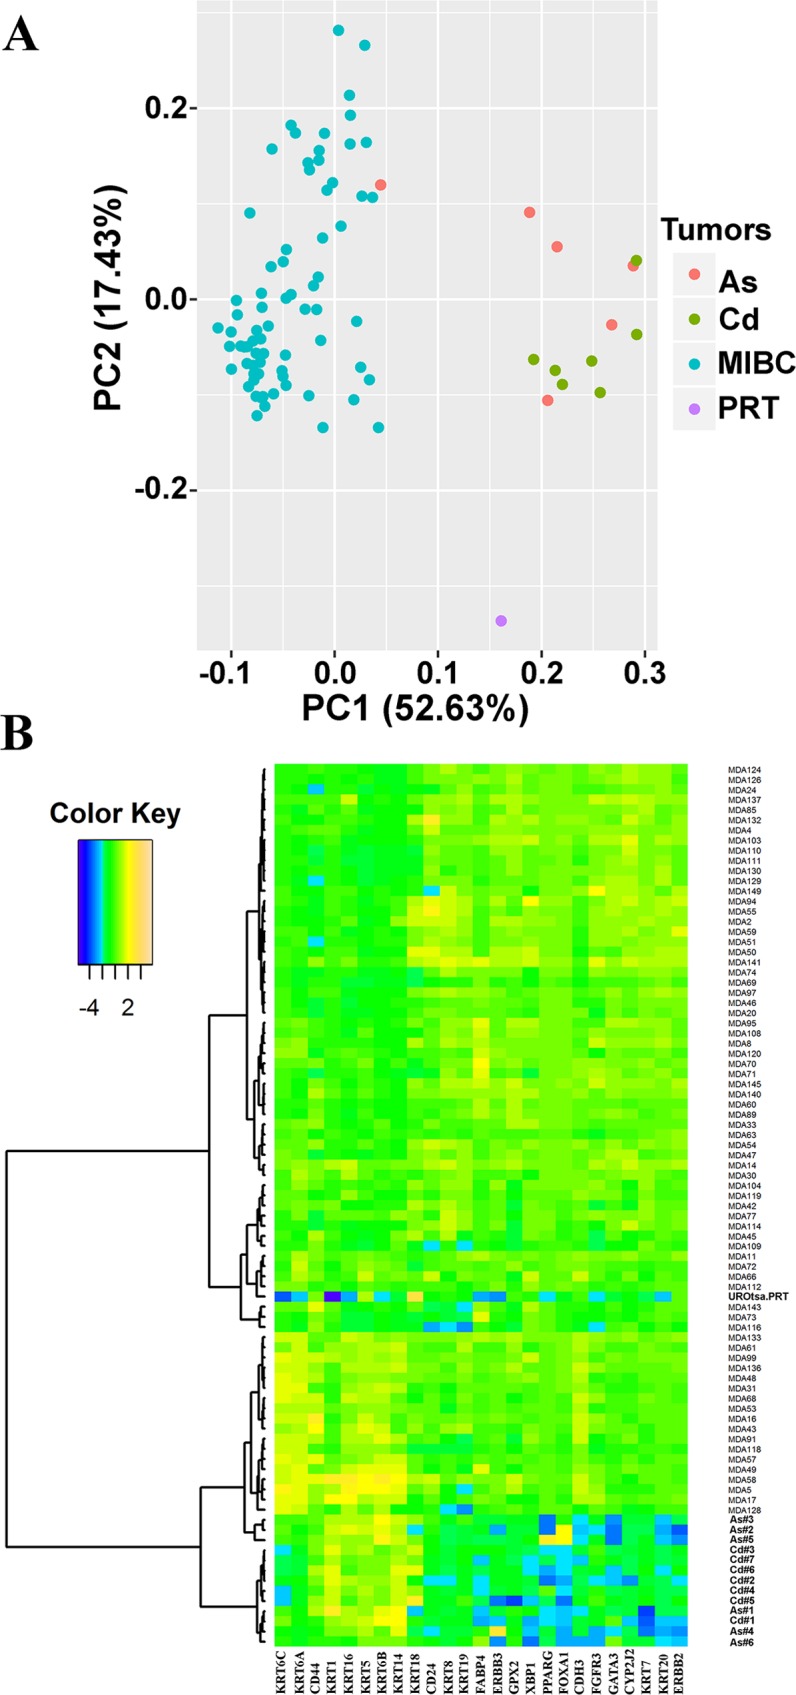
Fig 1. Analysis of gene expression patterns in As3+ and Cd2+ tumor transplants.

(A). Principal Components Analysis (PCA) plot of the MIBCs and UROtsa Cd2+ and As3+ tumor transplants. Seventy-three muscle invasive bladder cancers (MIBCs), six As3+-transformed UROtsa transplants and seven Cd2+-transformed UROtsa transplants were plotted onto the first two principal components, PC1 and PC2. The principal components were calculated from the 25 MIBC marker genes. (B). Heat map and the dendrogram on the 25 MIBC markers. Each row of the heat map represents a tumor sample, and each column represents one of the 25 marker genes. The dendrogram was generated using hierarchical clustering based on Pearson’s dissimilarity and Ward’s linkage.
