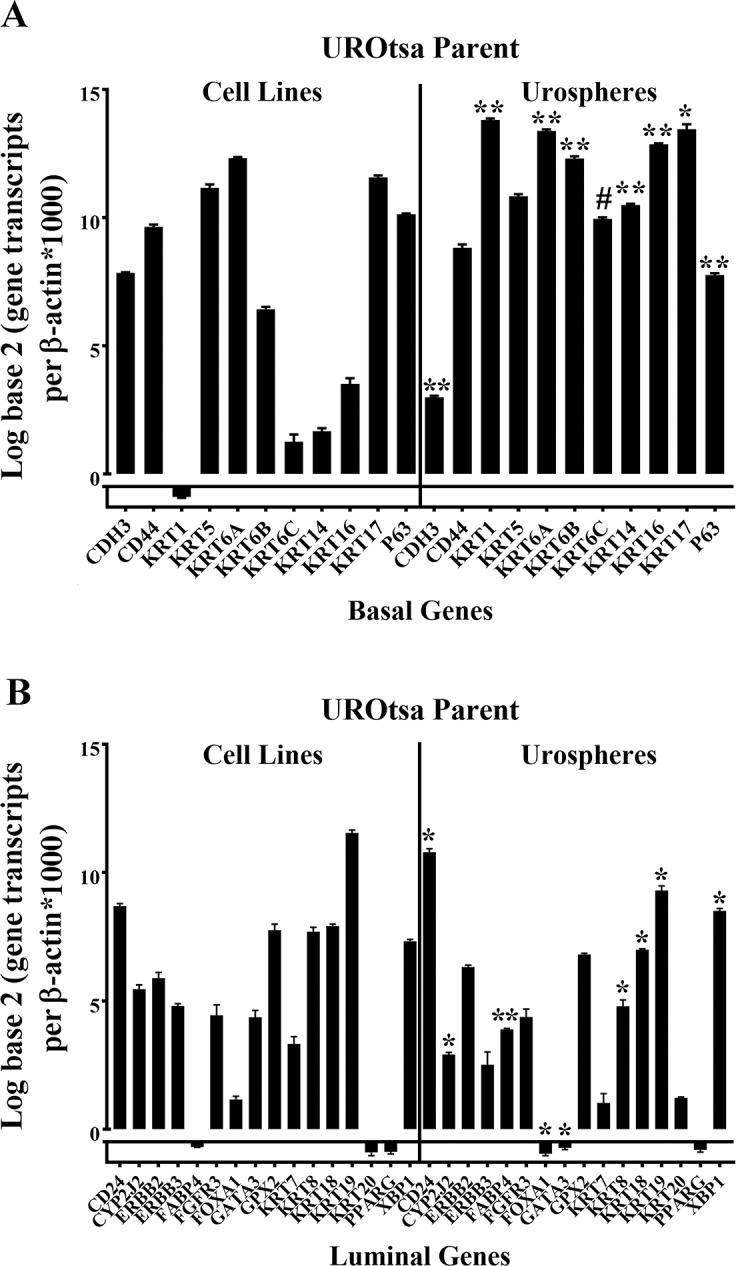
Fig 9. Gene expression analysis of basal and luminal marker genes in the UROtsa parent cell line and urospheres.

(A and B). Real-time PCR analysis of basal marker genes (A) and luminal marker genes (B) in the UROtsa parent and the urospheres. The analysis was done in triplicates and is plotted as the mean ±SD. The data is plotted on a log base 2 scale per transcript of β-actin times 1000. * indicates significantly different at p < 0.05 from parent UROtsa cells. # indicates significantly different at p < 0.01 from parent UROtsa cells. ** indicates significantly different at p < 0.0001 from parent UROtsa cells.
