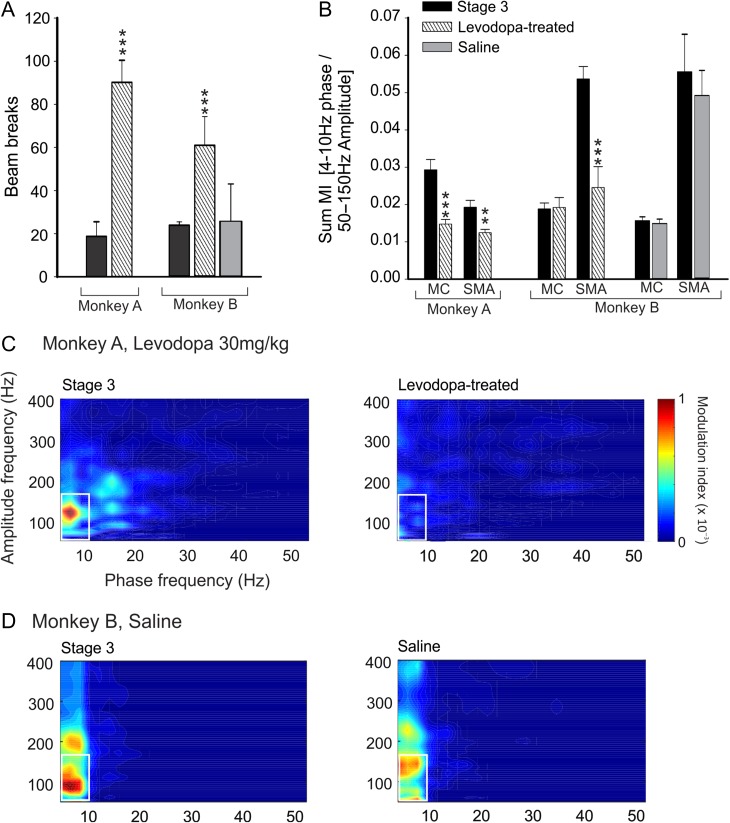
Figure 4.
Levodopa-induced changes in behavior and cortical PAC. (A) Increase of spontaneous movement 30 minutes after levodopa injection (30 and 20 mg/kg, respectively, for monkeys A and B), and absence of behavioral effect of saline injections (monkey B only). (B) Levodopa- and saline-induced changes of the sum MI values (means + SEM; *P < 0.05; **P < 0.01; ***P < 0.001; comparisons between sum MI values obtained preinjection and 30 min after injection, Wilcoxon signed rank test). (C) Examples of MI maps observed in the SMA of monkey A before levodopa injection (right) and 30 min following levodopa injection (left). (D) Examples of PAC maps observed in SMA of monkey B before and 30 min after saline injection.

