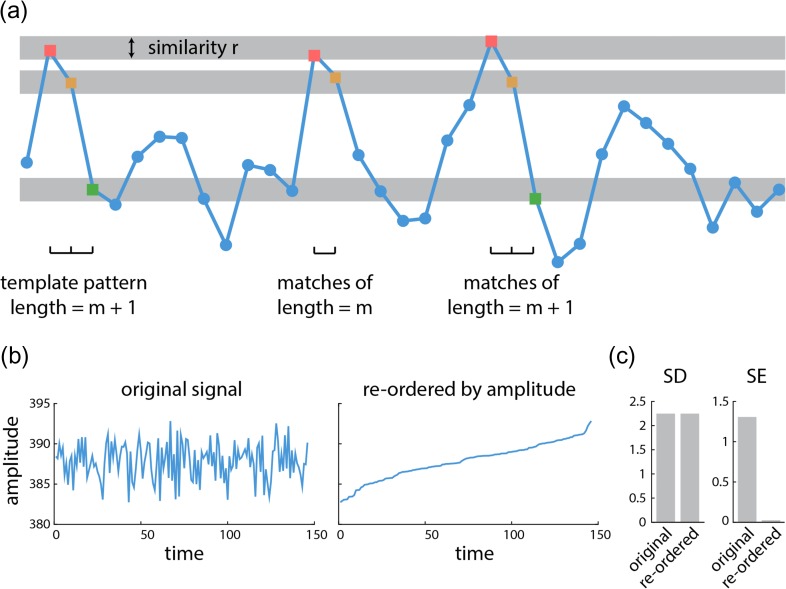
Figure 1.
Sample entropy of a time series | (a) An example of a BOLD signal is shown, where the x-axis is time and the y-axis is the amplitude. Signal variability is calculated using sample entropy analysis. Sample entropy (SE) measures the conditional probability that any two sequences of data points with length will be similar to one another under the condition that they were similar for the first points. The similarity criterion represents the tolerance of algorithm to accept matches in the time series. (b) An example of a BOLD signal in its original form (left). The same signal, with the time points reordered by amplitude (right). (c) Standard deviation of the signal is the same for both the original and reordered signal; however, sample entropy of the reordered signal drastically decreases compared with sample entropy of the original signal.

