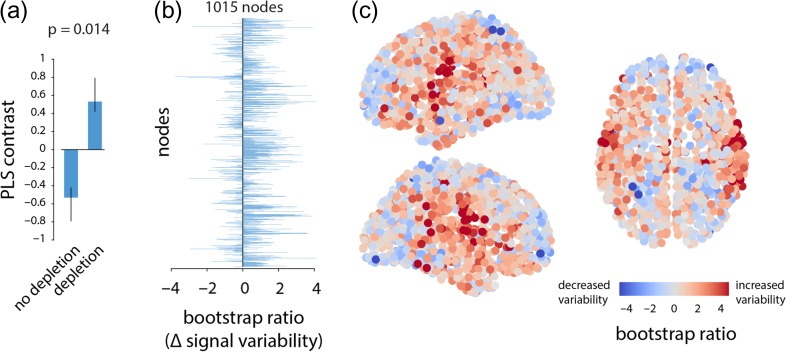
Figure 2.
Dopamine depletion increases signal variability | (a) PLS analysis identified a significant contrast between patterns of signal variability in depletion (APTD) versus non-depletion (BAL) conditions (permuted P =0.014). (b) The change in signal variability of each node is given by a bootstrap ratio for that node: such that a positive bootstrap ratio shows increase in signal variability of the node following dopamine depletion, while a negative bootstrap ratio shows the opposite. Bootstrap ratios are depicted at the finest resolution (1015 nodes), showing that dopamine depletion increases signal variability at most nodes. (c) Bootstrap ratios are shown in 3D space sagittally and axially. Corresponding results are shown for all resolutions in Figure S1.

