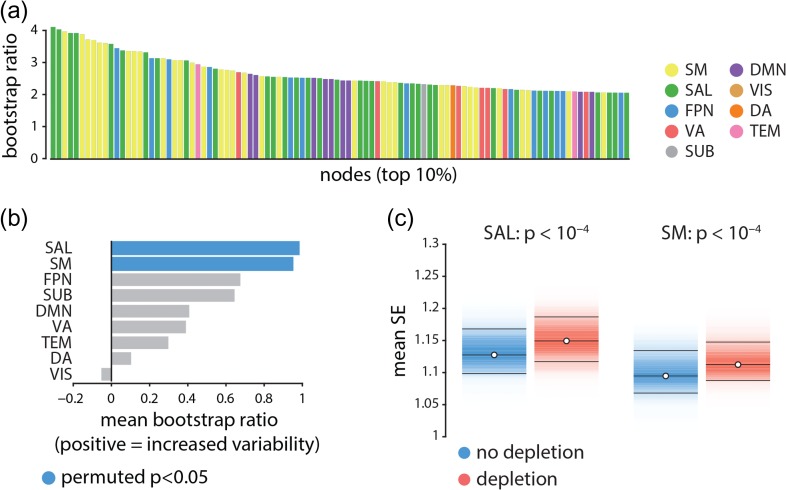
Figure 3.
Node- and network-level effects of dopamine depletion | (a) The top 10% of the nodes (i.e., top 100 nodes) that had the largest increase in signal variability (largest bootstrap ratios) following dopamine depletion. Each bar shows the magnitude of bootstrap ratio of a node and is colored based on the community assignment of that node (Mišić et al. 2015a). Somatomotor (yellow) and salience (green) networks appear over-represented compared with other networks. (b) The mean change in signal variability is calculated for each network and assessed by permutation tests (10 000 repetitions). Signal variability increases most in the salience and somatomotor networks following dopamine depletion, and these are the only two networks where this effect is statistically significant. (c) Changes in mean signal variability are depicted for somatomor and salience networks (significance obtained by permutation tests; FDR corrected (Benjamini and and Hochberg 1995)). SM = somatomotor, SAL = salience, FPN = fronto-parietal, VA = ventral attention, SUB = subcortical areas, DMN = default mode, VIS = visual, DA = dorsal attention, TEM = temporal.

