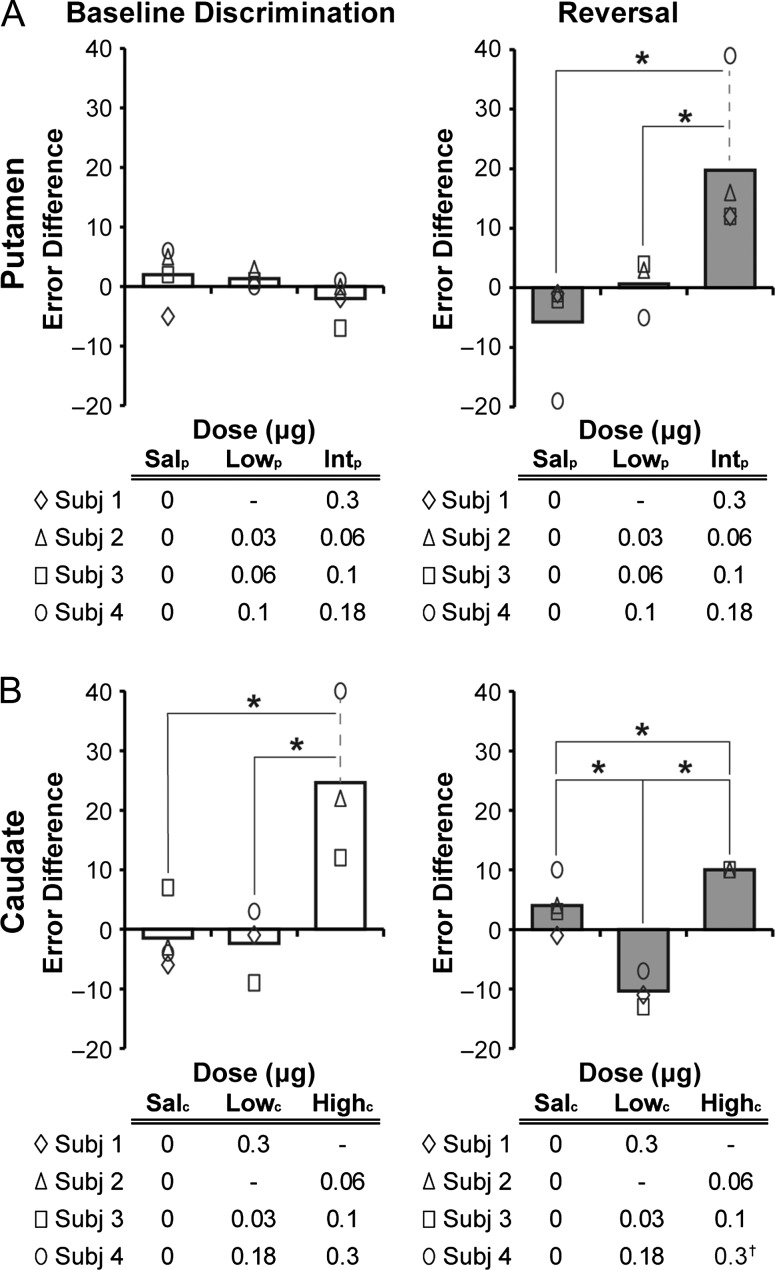
Figure 3.
Effects of intra-putamen (A) and intra-caudate (B) administration of muscimol and saline on the error difference score (number of errors in the infusion session minus errors from the preceding control session) in the baseline discrimination and reversal phases of the task. The bars in each plot represent the mean for saline and varying doses of intra-striatal muscimol (Sal = saline, Low = lower dose, Int = intermediate dose, High = higher dose, with subscripts “p” for “putamen” and “c” for “caudate”). Data for individual subjects are denoted by the symbols defined in the tables below each plot, where specific doses are also tabulated. †indicates that Subject 4’s high-dose data was not included in the analysis of reversal performance (see Results). * = P < 0.05 in post hoc tests.

