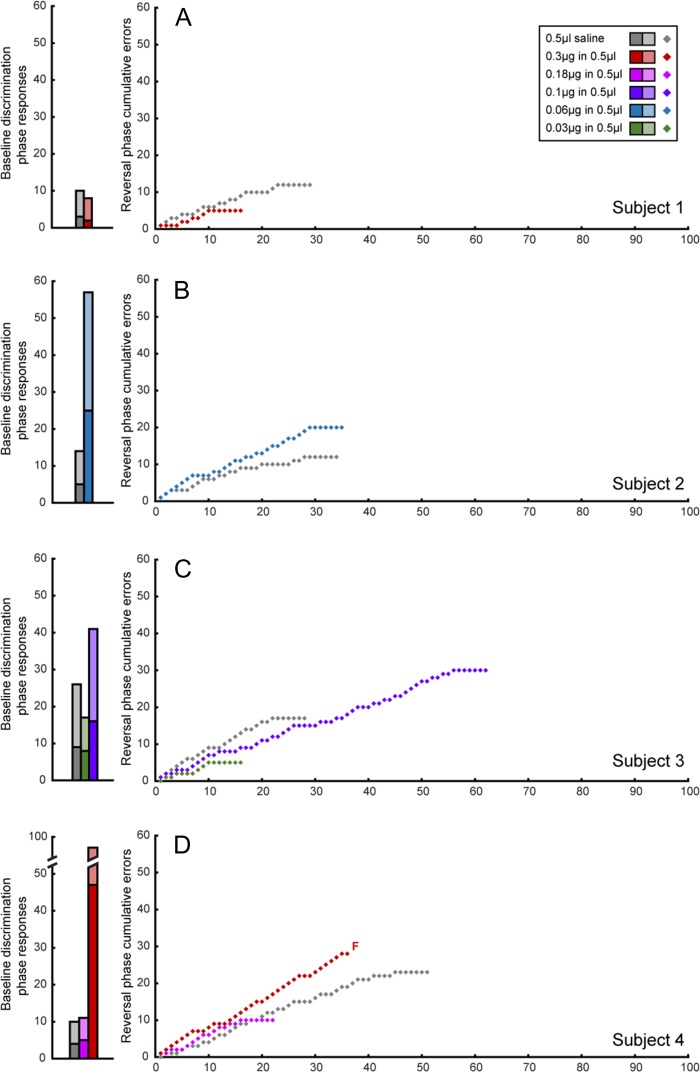
Figure 5.
Effects of intra-caudate administration of muscimol and saline on the baseline discrimination and reversal phases of the task per subject. Baseline discrimination phase performance is displayed as bar graphs with the total number of responses in the baseline discrimination phase, split into correct (light shading) and incorrect trials/errors (dark shading). Reversal phase performance is shown as a learning curve, with cumulative errors plotted against trials. F denotes the failure of a subject to pass the relevant phase at a specific dose.

