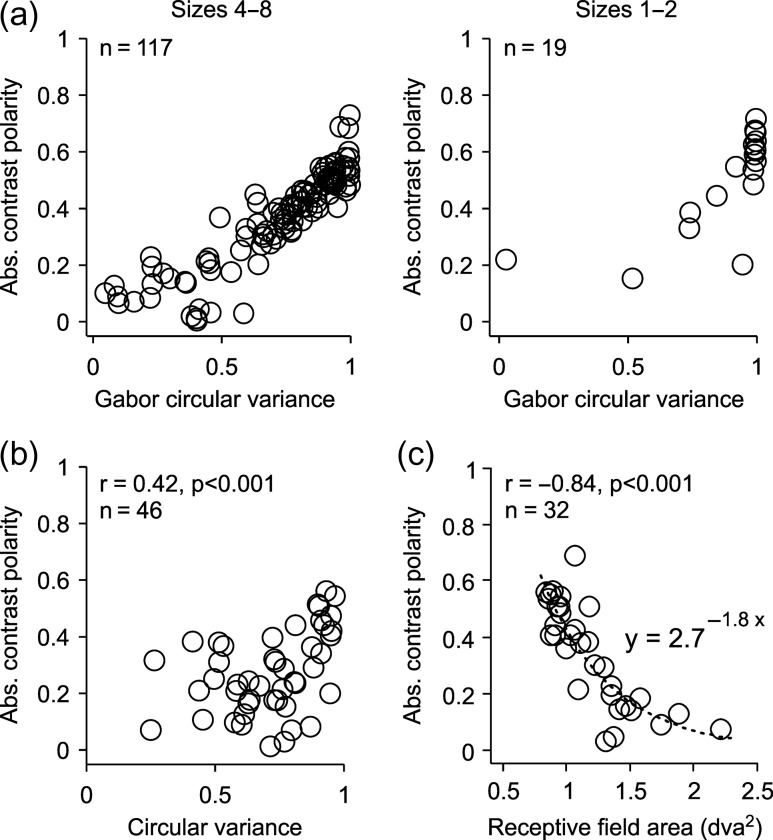
Figure 10.
Reducing stimulus size restricts the pool of ON- and OFF-dominated cortical RFs to those with greater ON or OFF dominance, less orientation selectivity, and smallest RFs. (a) Absolute contrast polarity plotted as a function of Gabor circular variance for the two largest (left, eight and four) and two smallest grating sizes (right, two and one). The Gabor circular variance is the circular variance calculated from a Gabor fit to the RF. Only the most accurate Gabor fits were selected (r2 ≥ 0.75, same for (a) and (c)). (b) Absolute contrast polarity plotted as a function of circular variance measured with drifting gratings. Circular variance was extracted from a von Mises fit to the orientation tuning and only the most accurate fits were selected (r2 ≥ 0.6). (c) Absolute contrast polarity plotted as a function of RF area extracted from a Gabor fit.

