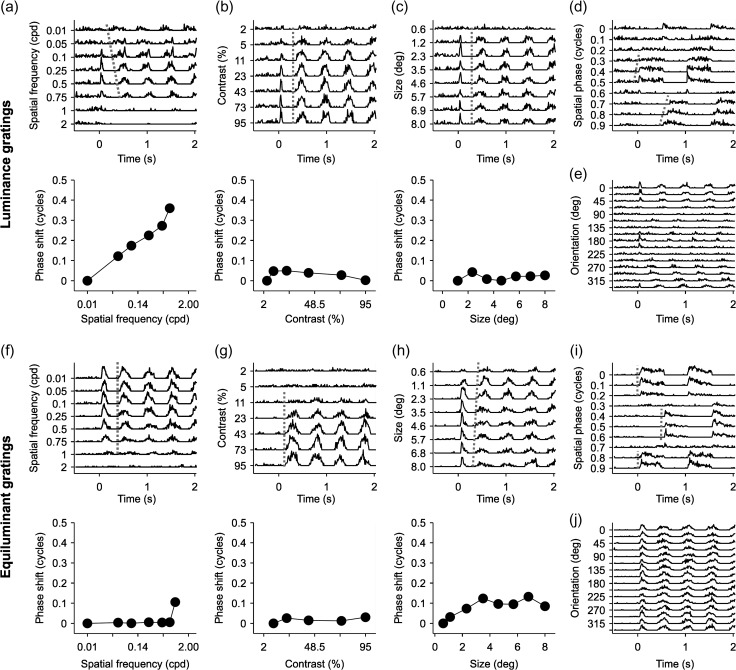
Figure 12.
Example cells illustrating changes in the temporal phase of visual responses to drifting gratings with different spatial frequencies. (a–e) Visual responses measured with black/white gratings in an example cell. PSTHs for (a) spatial frequency, (b) contrast, and (c) size tuning appear above, and measurements of phase shifts appear below. The parameters for each response property appear on the y-axis for each PSTH series. Phase shifts are shown as a fraction of a cycle. Phase shifts were calculated from the F1 harmonic for all responses where F1 > F0. (d) PSTHs showing the tuning for spatial phase for the same cell, which was measured with static gratings that were turned on and off at 1 Hz. The gratings were presented at 10 different spatial phases (0–0.9), starting at a time zero. (e) PSTHs showing the orientation tuning for the same cell, which was measured with gratings drifting at 2 Hz. (f–j) Same as (a–e) for a second cell using RG equiluminant gratings.

