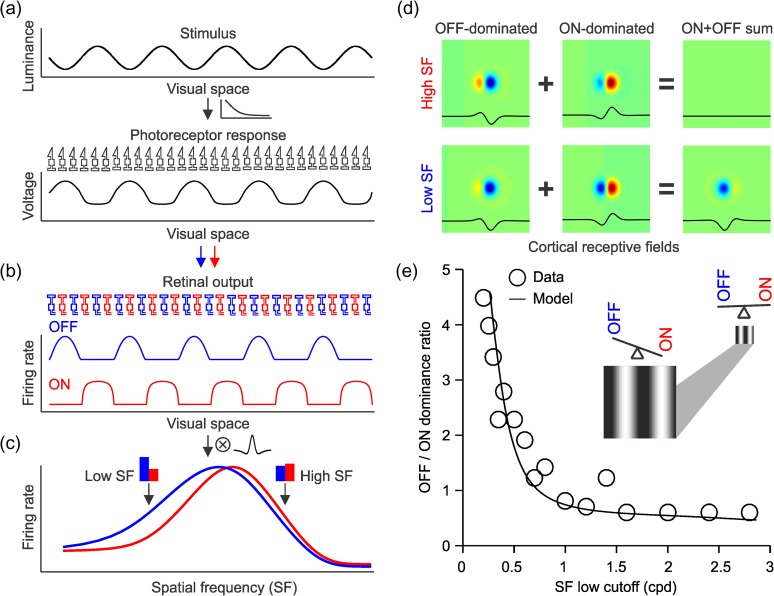
Figure 14.
ON luminance/response saturation explains changes in cortical OFF dominance with spatial frequency. (a) The grating stimulus was simulated with a cosine function (top) and we assumed a photoreceptor nonlinearity that distorted the representation of the grating at the level of the response of the photoreceptor array (bottom). (b) The responses of separate ON and OFF pathways were simulated by rectifying the photoreceptor response and passing the output of the rectification through a higher luminance response saturation for ON than OFF responses as in the study of Kremkow, Jin, et al. (2014). (c) When the responses from these ON and OFF pathways are convolved with a cortical RF, OFF responses dominate at low spatial frequencies (low SF) as in the study of Kremkow, Jin, et al. (2014). (d) When a complex RF is made by adding OFF dominated and ON-dominated simple cells with opposite phases, the ON–OFF sum is zero (top). At low spatial frequencies, however, OFF responses become stronger and the complex cell becomes OFF dominated (bottom). (e) This simple model accurately replicates the relation between spatial frequency low cutoff and the ratio of OFF-to-ON-dominated neurons that we demonstrated experimentally. The circles illustrated the data and the line the model. The cartoon illustrates how ON–OFF balance changes when viewing distance increases, which makes the grating smaller and the spatial frequency higher.

