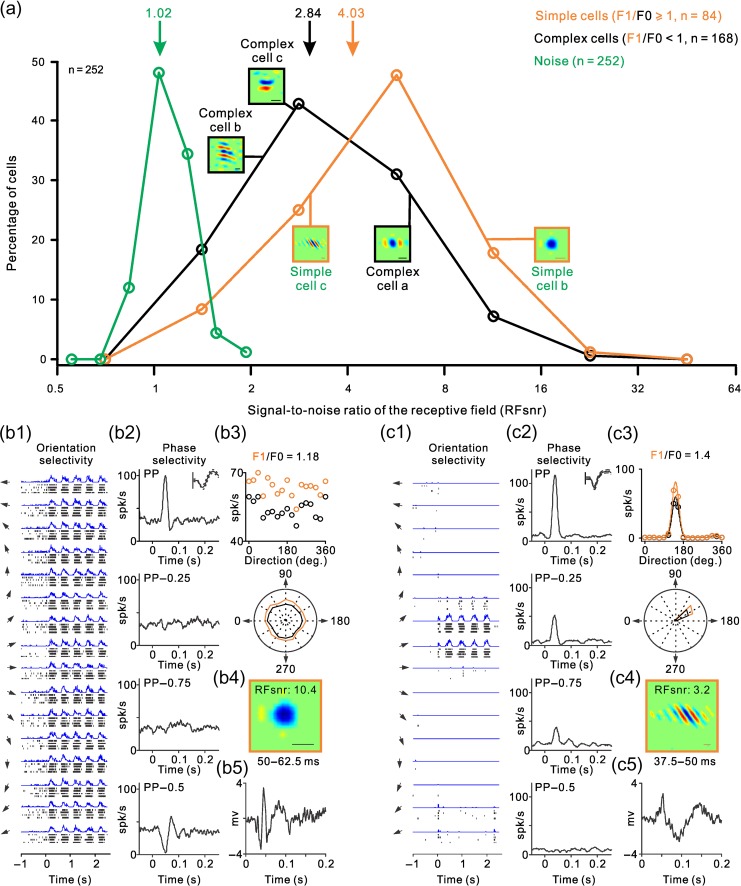
Figure 3.
ON–OFF RF organization of simple and complex RFs with examples of simple RFs. (a) Distribution of signal-to-noise ratios in the RFs of simple cells (orange), complex cells (black), and baseline noise (green). Notice the extensive overlap in the distribution of simple and complex RFs. Arrows at the top show distribution means and small square panels illustrate example RFs. (b) Response properties of an example simple cell. b1 shows the rasters and PSTHs of responses to gratings drifting at different directions (arrows illustrate the direction of motion, stimulus onset is marked as 0 in the x-axis). b2 shows the phase selectivity measured as the average response to the 10 preferred gratings, at the preferred phase and phases apart by 0.25 (PP − 0.25 and PP − 0.75) and 0.5 cycles (PP − 0.5). The spike waveform is shown at the top right corner of the panel (continuous line: average, dashed lines: standard deviation). Vertical scale bar (100 μV). b3 shows the response amplitude to gratings drifting at different directions measured as mean rate (F0, in black) and as the sinusoidal modulation of the PSTH at the fundamental frequency of the stimulus (F1, in orange). The response amplitudes to different grating directions are illustrated as a scatter plot (top) and polar plot (bottom). The F1/F0 ratio is shown at the top. b4 shows the RF measured with grating spike-triggered average at the temporal window shown at the bottom (50–62.5 ms). RFsnr is the signal-to-noise ratio of the RF. Line scale at the bottom right corner is 1°. b5 illustrates the local field potential measured with flashed gratings averaged across different orientations. (c) Same as b but for another example simple cell.

