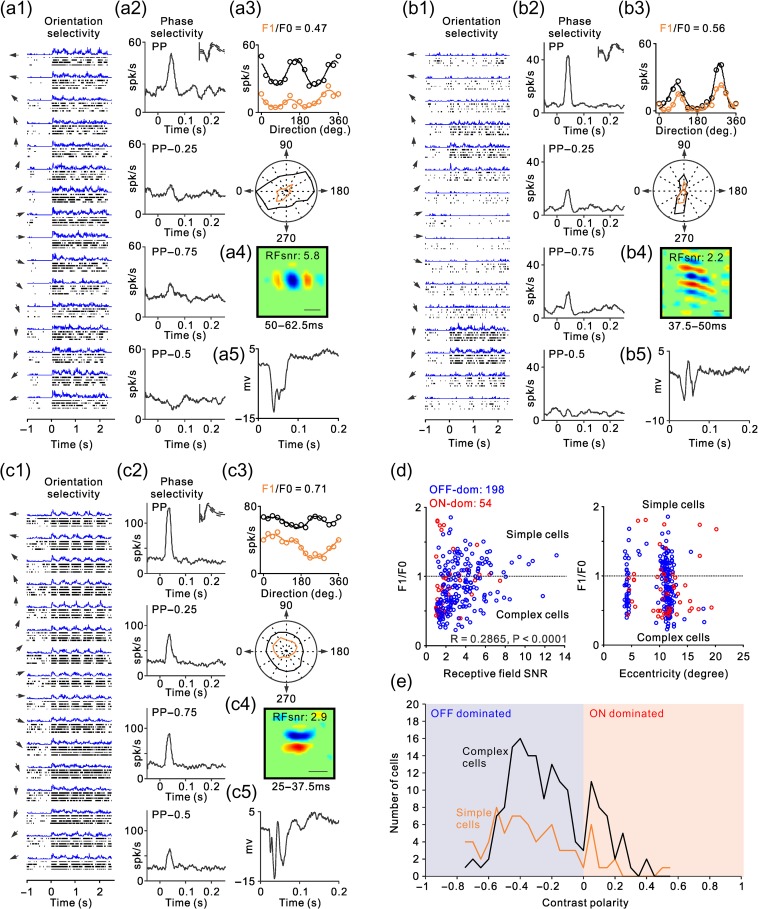
Figure 4.
Examples of ON–OFF RF organization in complex cells. (a–c) Same as Figure 3b–c but for examples of complex RFs. (d) Scatter plot illustrating the relation of linearity of spatial summation (F1/F0) with the signal to noise of the RF (left) and visual eccentricity (right). The F1/F0 ratio should be higher than one when the ON and OFF subregions are spatially segregated and should approach zero when the ON and OFF subregions are spatially overlapped. The signal-to-noise ratio (SNR) should approach one when ON and OFF subregions are identical in position, size, and strength because the ON–OFF subtraction approaches zero plus the noise (the signal equals the noise and the SNR equals one). The SNR should be higher than one if the relative strength of ON and OFF subregions varies at each spatial location and the complex RF has ON and OFF subregions. The two clusters for visual eccentricity correspond to neurons recorded in the operculum and the superior bank of the calcarine sulcus. (e) Distribution of RF contrast polarity for complex cells (black) and simple cells (orange). OFF-dominated RFs are shown on the left (blue) and ON-dominated RFs on the right (red).

