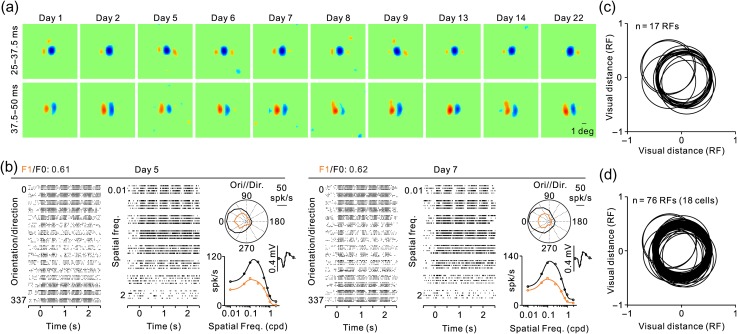
Figure 5.
RF of a complex cell measured multiple times over 1 month. (a) RF measurements with grating spike-triggered-averaging shown for two different time windows, 25–37.5 ms (top row) and 37.5–50 ms (bottom row). Notice that the RF has a strong OFF subregion at short response latencies and two parallel ON and OFF subregions at longer latencies that match the preferred orientation of the cell. (b) Rasters showing the orientation and spatial frequency selectivity of the cell measured in 2 different days (left and right panels). Within each day, the figure illustrates rasters for different directions of motion (left) and different spatial frequencies (middle), a polar plot of the orientation/direction tuning (top right), and the spatial frequency tuning (bottom right). Measurements are shown in black for mean firing rate (F0) and orange for sinusoidal responses at the frequency of the drifting grating (F1). The spike waveform is shown on the top right corner of the spatial frequency tuning. (c) Central position of the strongest RF subregion from the cell illustrated in a and b measured in different days. Each circle has a diameter equal to the dominant RF subregion and its center is the RF center measured on a different day. Units of distance are given in RF subregion diameters. (d) Same as c but for multiple cells with RFs mapped in multiple days. For each cell, the RF position measured in the first day was aligned at 0.

