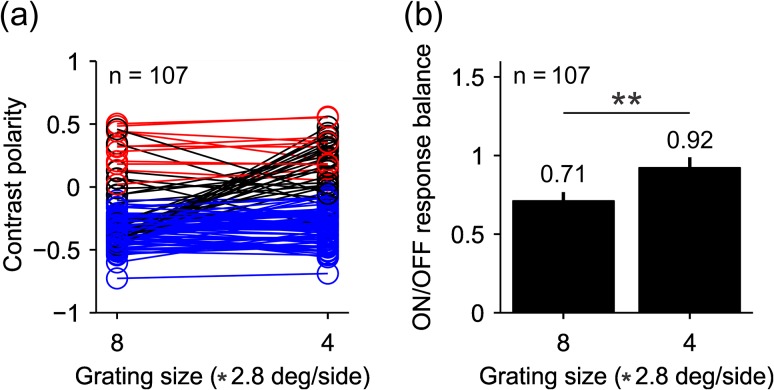
Figure 7.
Some cells switch contrast polarity when the size of the grating is reduced. (a) contrast polarity for a subset of cells that could be mapped with the two largest gratings sizes, 8 and 4 (2.8 * 8 or 4 °/side). Cells that do not switch contrast polarity are represented by red circles and lines when they are ON dominated (n = 11) and blue circles and lines when they are OFF dominated (n = 71). Black circles and lines represent cells that switched polarity (n = 25). Notice that the number of RFs measured with both grating sizes (n = 107) is smaller than the number of RFs measured just with grating size-4 (n = 125) because some RFs were mapped with size-4 but not size-8. (b) The average ratio of ON–OFF responses across the 107 cells was closer to one for gratings with size-4 than size-8 (P = 0.0012, Wilcoxon test).

