Figure 9.
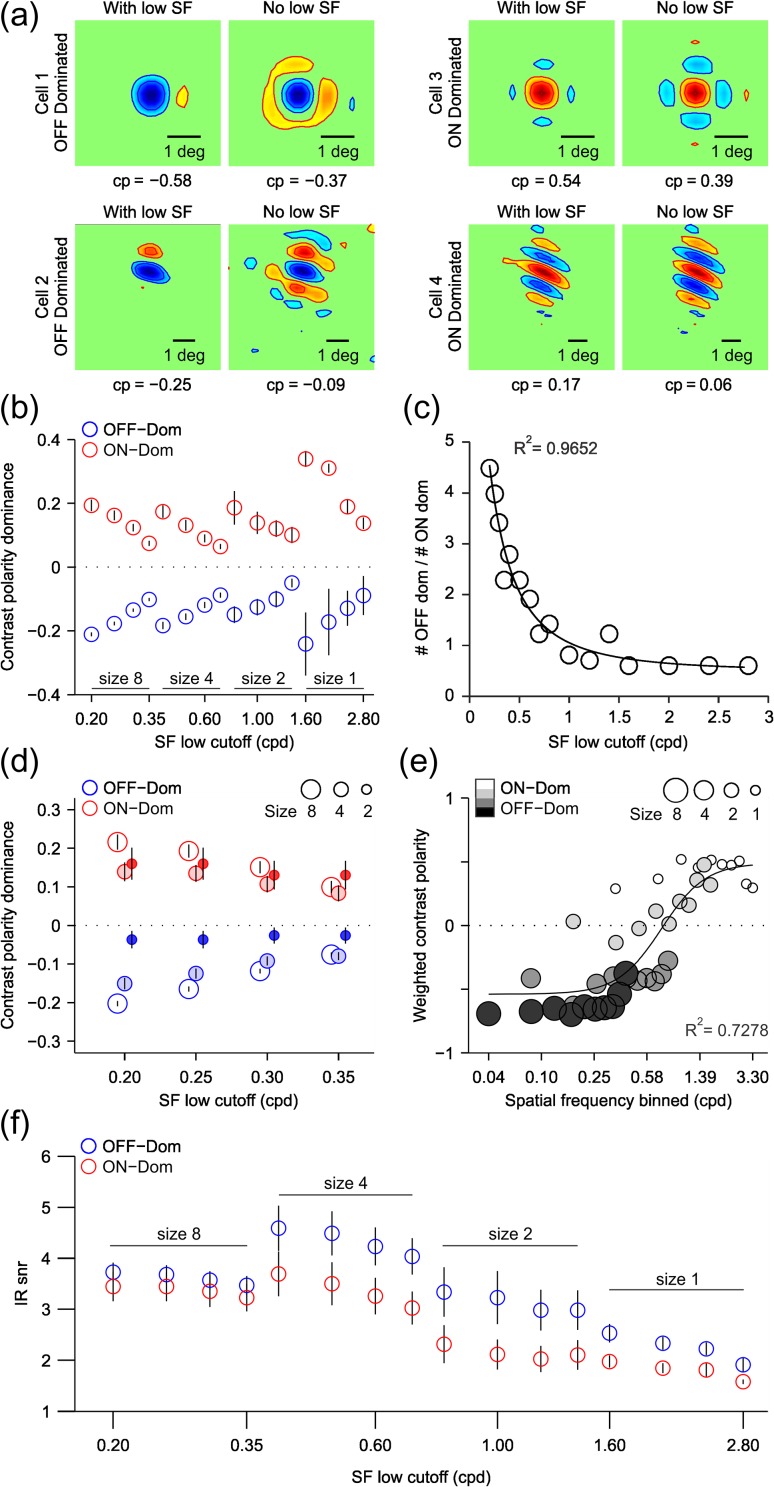
ON/OFF response balance equalizes for each single neuron as spatial frequency increases and grating size decreases. (a) RFs from four example cells calculated by grating spike-trigger-averaging using the full spatial frequency range of the grating sequence (left, with low SF) or with spatial frequencies lower than 0.2 cpd removed (right, no low SF). The left panels are OFF-dominated cells and right panels are ON-dominated cells. Contrast polarity (CP) is shown below each RF. Notice that the contrast polarity decreases for all four cells when the low spatial frequencies are removed. (b) contrast polarity as a function of spatial frequency for OFF-dominated (blue) and ON-dominated (red) RFs measured with four different grating sizes (8, 4, 2, 1) and different spatial frequency ranges. The x-axis shows the value of the lowest spatial frequency within the range. Error bars show standard errors. (c) Ratio of OFF-dominated to ON-dominated RFs as a function of spatial frequency across all four grating sizes. The circles show the data values and the solid line is a Gaussian fit to the data (r2 = 0.97). (d) contrast polarity for three grating sizes (circles of different size) for four matched spatial frequency ranges. (e) Weighted contrast polarity (y-axis) measured across grating sizes with a moving spatial frequency window. X-axis gives the lower value of each spatial frequency window (see Materials and Methods for more details). The solid line is the fit of a sigmoidal function to the data (r2=0.73). (f) Signal-to-noise ratio of the temporal impulse response (IRsnr) plotted as a function of spatial frequency for OFF-dominated (blue circles) and ON-dominated (red circles) neurons across all grating sizes. Error bars are standard errors. The x-axis shows the value of the lowest spatial frequency within the range (same for b, c, and f).

