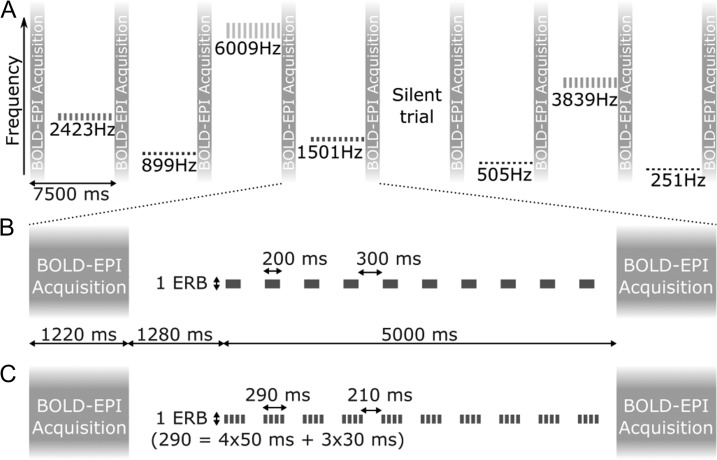
Figure 2.
Stimulus presentation and fMRI protocol. (A) Timelime of 8 example fMRI trials showing all 7 stimulus frequencies and one silent trial. The long vertical bars represent the image acquisitions. The short bars show the stimulus sequences presented in between, with center frequency and bandwidth indicated on the vertical axis (representing a linear frequency scale). (B and C) Detailed timeline of a single stimulus trial presented to the first (B) and second (C) halves of the subjects.

