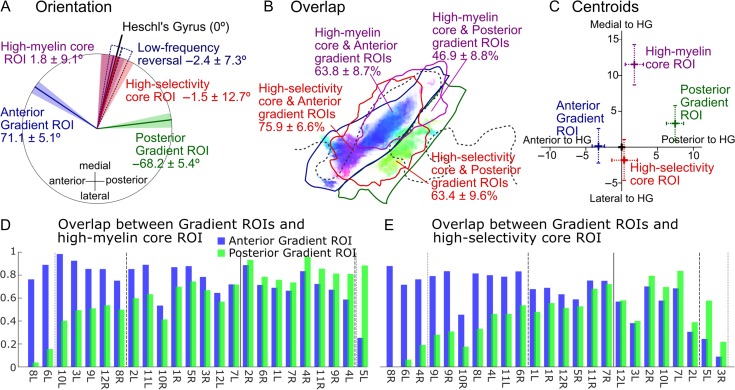
Figure 5.
Orientations, overlap, and centroids of individual core and gradient ROIs. (A) Average gradient directions within the anterior and posterior gradient ROIs (blue and green), as well as long-axis orientations of the core ROIs (red and purple) and low-frequency tonotopic gradient reversal on HG (dark blue). All orientations are expressed relative to the long-axis orientation of HG (black line). The mean orientations are shown by the colored lines, and the 95% CIs by the shaded areas. (B) Overlap of the 2 core ROIs (high-selectivity/high-myelin) with each of the 2 gradient ROIs (anterior/posterior). The figures give the mean overlap and 95% CIs across 24 hemispheres. The ROI outlines (solid lines) are from the group-average data (Fig. 3B,D,E) and thus only indicative. They were derived using the same methods as for the individual ROIs (see text). The shaded highlight shows the significantly consistent local gradient directions replotted from Figure 3B. (C) Centroids of the core and gradient ROIs in relation to the centroid and long-axis orientation of the HG ROI (corresponding, respectively, to the origin and vertical axis). Crosses and error bars show the means and 95% CIs, respectively. (D) Degree of overlap between the high-myelin core ROI and the anterior (blue bars) and posterior (green bars) gradient ROIs in individual hemispheres. Hemispheres are sorted according to the ratio of 2 overlap values (greater overlap with the anterior gradient ROI towards the left). Vertical dotted and dashed black lines mark the points where the lesser overlap is within one-third and two-thirds of the greater overlap, respectively. The vertical solid black line indicates the point of equality between overlap values. (E) Same as in D but for the high-selectivity ROI.

