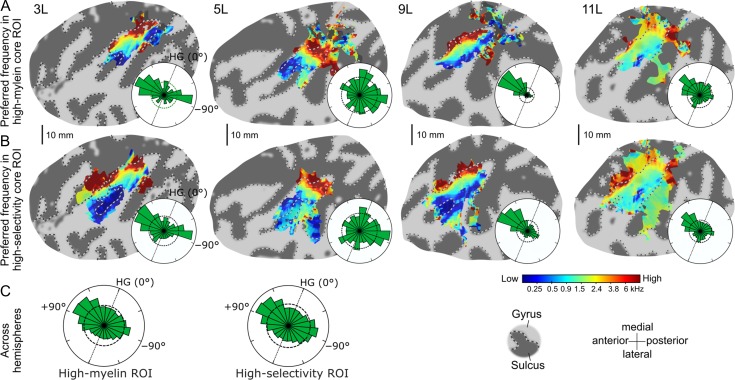
Figure 6.
Preferred-frequency maps and histograms of local tonotopic gradient directions contained within the core ROIs. (A) Individual preferred frequencies (flat maps) and circular gradient direction histograms (insets) within the high-myelin ROI for the same four left hemispheres as shown in Figure 4. The histograms were normalized to fit. The straight black dotted lines within them show the long-axis orientation of HG, and the black dashed circles show circular uniform distributions representing the null hypothesis that all gradient directions were equally prevalent. (B) Same as in A, but for the high-selectivity ROI. (C) Aggregate gradient direction histograms across all 24 hemispheres (gradient directions from right hemisphere ROIs were sign-reversed).

