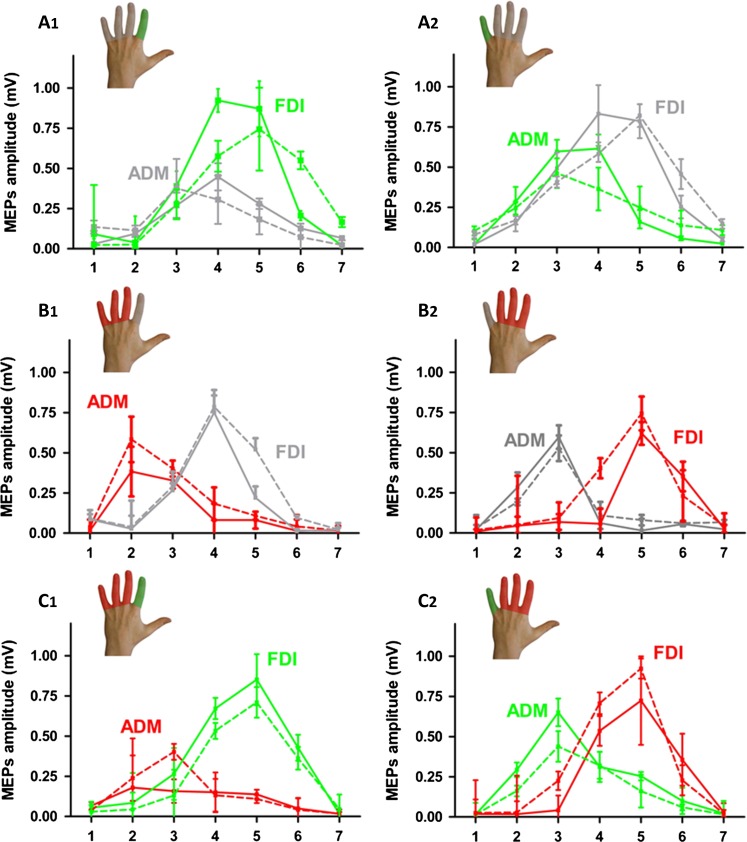
Figure 4.
Mediolateral cortical excitability profiles of the FDI and ADM muscle obtained with neuronavigated single-pulse TMS in the three experimental groups (A1/A2, B1/B2, and C1/C2). The color of the lines indicates whether the muscle was trained (green), immobilized (red), or neither immobilized nor trained (gray) on day 1 (dotted line) and day 8 (full line). Data points represent the mean value of each group. Error bars equal SEM.

