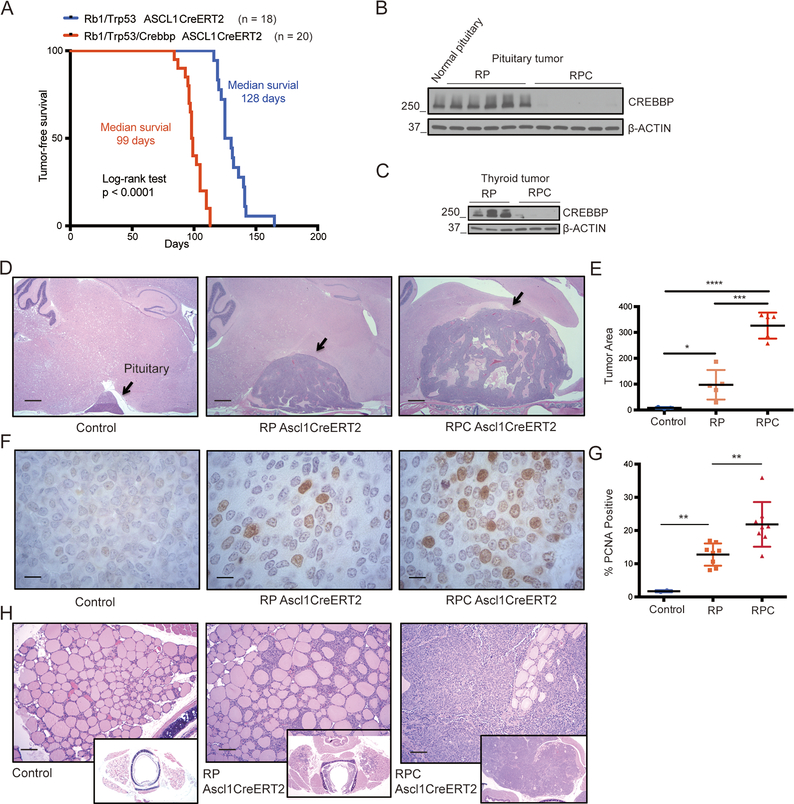
Figure 2. Crebbp inactivation accelerates pituitary and thyroid neuroendocrine tumors.
A, Kaplan-Meier tumor-free survival curves of double knockout mice (Rb1lox/lox;Trp53lox/lox;ASCL1CreERT2, green, n=18) and triple knockout mice (Rb1lox/lox;Trp53lox/lox;Crebbplox/lox;ASCL1CreERT2 red, n=20). Log-rank (Mantel-Cox) test was used to determine the significance of tumor-free survival between the cohorts.
B, Representative immunoblotting results of CREBBP protein levels in pituitary tumors from 5 mice in each cohort. Normal mouse pituitary was used as a control. RPC represents Rb1/Trp53/Crebbp; RP represents Rb1/Trp53.
C, Representative immunoblotting showing CREBBP protein levels in thyroid tumors from 3 mice in each cohort.
D-E, Mice with the indicated genotypes were euthanized 3 months after tamoxifen (TAM) injection. (D) Representative H&E stained sections showing normal pituitary gland and pituitary tumors, scale bar = 500μm. (E) Average area of pituitary and pituitary carcinomas in each cohort quantified with n= 5 mice in each cohort. Statistical significance was determined by two-tailed unpaired Student’s t- test; *, p<0.05; ***, p<0.001; ****, p<0.0001.
F-G, Representative IHC of PCNA in normal pituitary and in pituitary tumors from each cohort. Scale bar = 20μm. (G) Quantification of positive PCNA staining in normal pituitary tissues and pituitary tumors in each cohort. **, p<0.01.
H, Representative H&E stained sections of normal thyroid and thyroid tumors from mice in each cohort, 3 months after TAM injection. Scale bar = 500μm. Also see related Figure S4 for images of tumor histology at time of animal morbidity.

