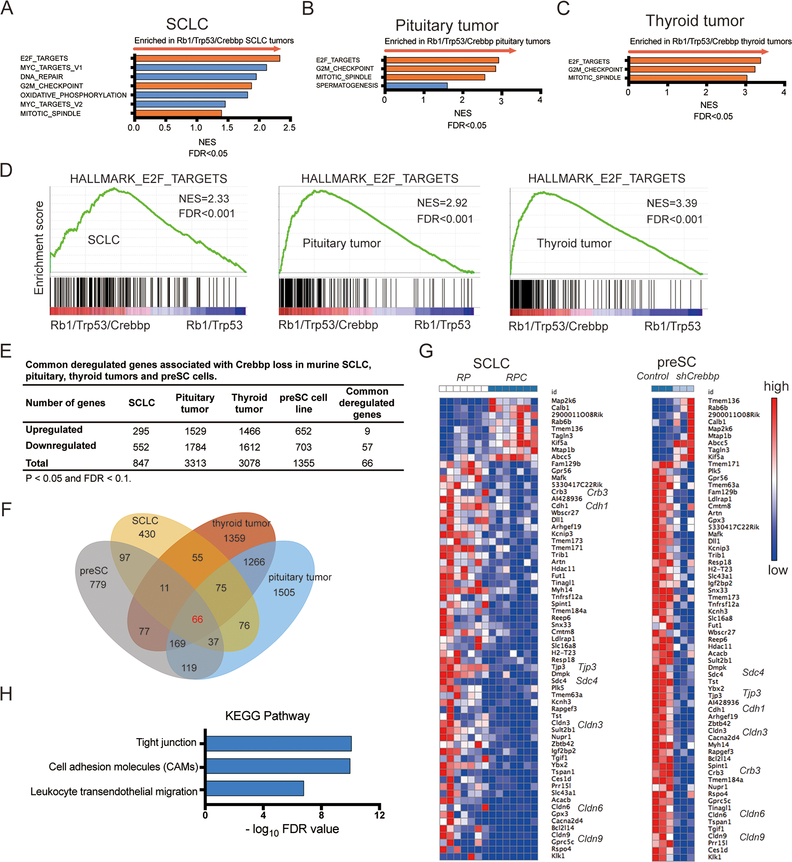
Figure 3. Gene expression analyses of CREBBP-perturbed neuroendocrine tumors.
A-C, Gene set enrichment analysis (GSEA) identifies biological processes and pathways enriched in Crebbp-deleted tumors across 3 murine neuroendocrine tumor types (A) SCLC (n=7 Rb1/Trp53/Crebbp vs. 7 Rb1/Trp53), (B) pituitary carcinomas (n=8 Rb1/Trp53/Crebbp vs. 9 Rb1/Trp53), and (C) thyroid c-cell tumors (n= 5 Rb1/Trp53/Crebbp vs. 7 Rb1/Trp53). Red bars show 3 gene sets shared among the three murine neuroendocrine tumor types with FDR<0.05.
D, GSEA plots showing the top gene set enriched in the Crebbp-deficient neuroendocrine tumors, “E2F_Targets.”
E, Summary of commonly dysregulated genes upon Crebbp deletion in three neuroendocrine tumor types (SCLC, pituitary and thyroid tumors) and Crebbp knockdown preSC cells. p< 0.05 and FDR< 0.1.
F, Venn diagram showing 66 genes commonly deregulated in 3 Crebbp-deficient neuroendocrine tumor types compared to Crebbp-wild type controls as well as in preSC cells with lentiviral Crebbp shRNA expression (3 different shRNA sequences included in analysis).
G, Heat map of the 66 commonly dysregulated genes with Crebbp suppression in SCLC primary tumors and preSC cells. Red denotes high expression, blue denotes low expression. RPC represents Rb1/Trp53/Crebbp; RP represents Rb1/Trp53.
H, KEGG pathway enrichment analysis of 66 differentially expressed genes identified significantly enriched biological pathways such as tight junctions and cell adhesion molecules. Top enriched pathways shown.

