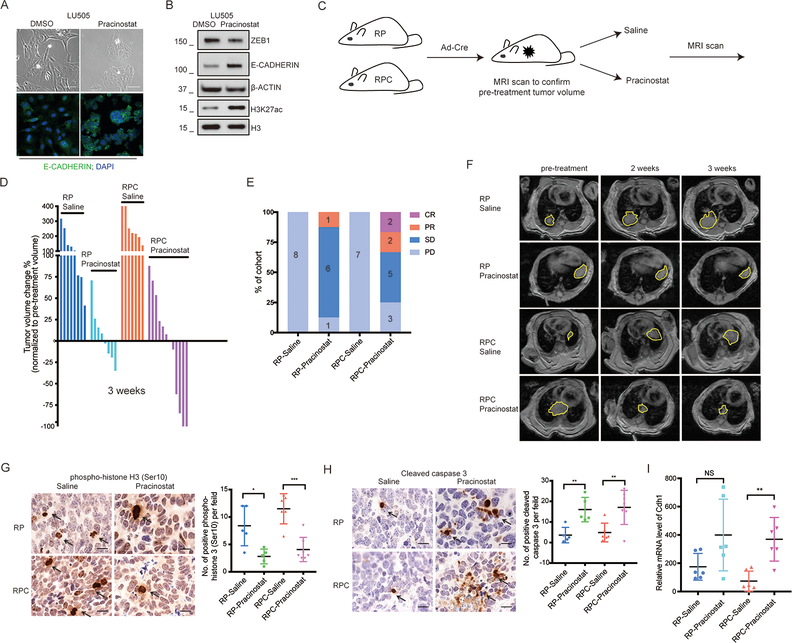
Figure 7. Enhanced efficacy of HDAC inhibition with Crebbp mutation in SCLC.
A, Representative phase contrast microscopic photos (top) and E-CADHERIN immunofluorescence (bottom) in LU505 cells treated with DMSO or Pracinostat (125nM) for 21 days (Upper). Scale bar = 100μm. DAPI was used to stain nucleus. Original magnification, 40×.
B, LU505 SCLC cells treated with DMSO or Pracinostat for 21 days were probed for ZEB1, E-CADHERIN and SLUG (whole cell lysates) and H3K27ac and H3 (acid extraction of histones).
C, Schematic of treatment trial with saline (control) and Pracinostat in RP (Rb1/Trp53 mutant) and RPC (Rb1/Trp53/Crebbp mutant) SCLC autochthonous models with lung tumor burden detected by MRI. Pracinostat dosed at 100mg/kg orally, 5 times per week.
D, Tumor volume changes (%) based on MRI scan quantification in RP and RPC mice treated with saline and Pracinostat for 3 weeks, normalized to pre-treatment tumor volume.
E, Treatment response divided into PD (progressive disease, >30% tumor volume increase), SD (stable disease, < 30% change in tumor volume in either direction), PR (partial regression >30% regression) and CR (>90% regression) in RP and RPC mice treated with saline and Pracinostat. Data are presented as percentage of mice in each treatment group.
F, Representative MRI images of the thorax regions of mice treated with saline or Pracinostat at pre-treatment compared to 2- and 3-weeks of treatment in each group.
G-H, Representative IHC staining of phospho-histone H3 (Ser10) and cleaved caspase 3 in primary SCLC tumors of mice treated with saline vs. Pracinostat at 3 weeks (end of treatment). Scale bar = 20μm. Data are presented as number of positive phospho-histone H3 (Ser10) cells per field. The p value between different groups was calculated using unpaired student’s t-test. RP-saline, n= 5 mice, RP-Pracinostat, n = 5 mice, RPC-saline, n = 7 mice and RPC-Pracinostat, n = 6 mice. *, p<0.05. **, p<0.01. ***, p<0.001.
I, Quantitative reverse-transcription PCR analysis of Cdh1 mRNA levels in primary SCLC tissues derived from RP and RPC mice treated with saline or Pracinostat at 3 weeks. n = 6 mice in each treatment group. NS, not significant. **, p<0.01, unpaired student’s t-test.

