
Figure 1:
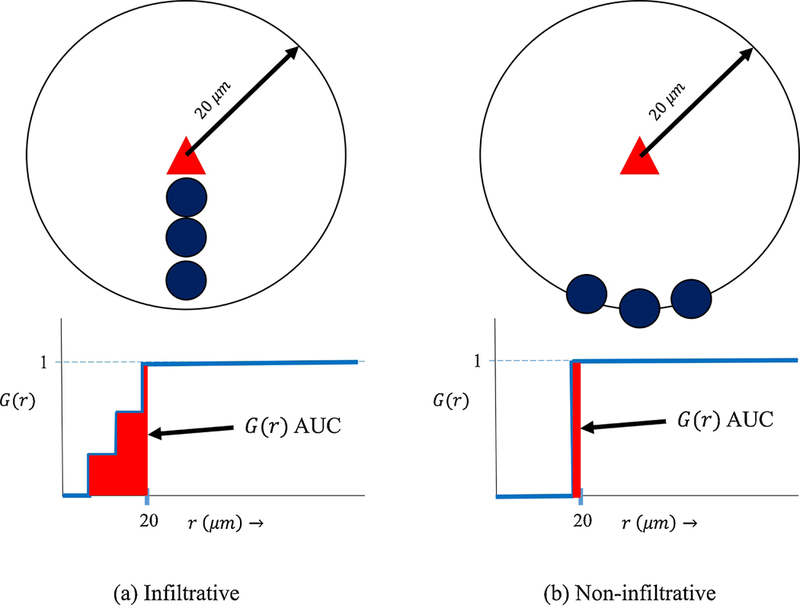
The G-cross function quantitatively differentiates between scenarios (a) and (b) representing infiltrative cells (dark blue circles) densely co-located with tumor cells (triangle) (a) vs. non-infiltrative cells close to but clustered away from tumor cells (b) within a 20 μm radius. A simple count of number of immune cells within a 20 μm radius of the tumor cell cannot distinguish between the different intercellular spatial relationships in (a) and (b). The corresponding area under the G-cross curves (AUC) for scenario (a) vs (b) is much greater in scenario (a), clearly differentiating the levels of infiltration visually observed.