
Figure 2:
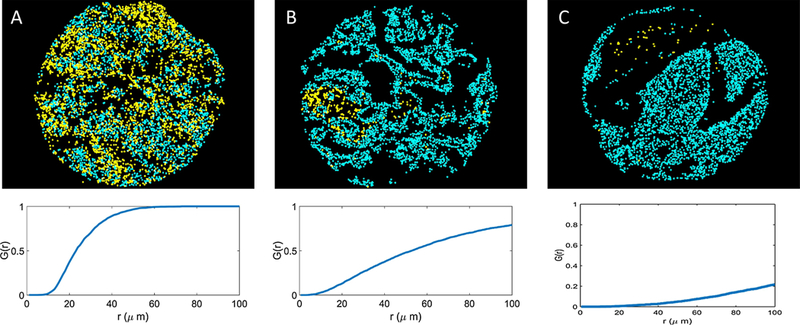
The G-cross function is a quantitative measure of qualitative immune cell infiltration. Here, by computing the area under the G-cross curves for yellow and blue cells in slides A, B, and C, we quantify the infiltration of the yellow cells into the blue cells on each respective slide. These examples demonstrate different levels of yellow: blue cell infiltration: (A) high, (B) medium, and (C) low. Corresponding G-cross curves rise sharply in (A), moderately in (B), and slowly in (C). Each infiltration type A, B, and C is associated with a unique G-cross signature.