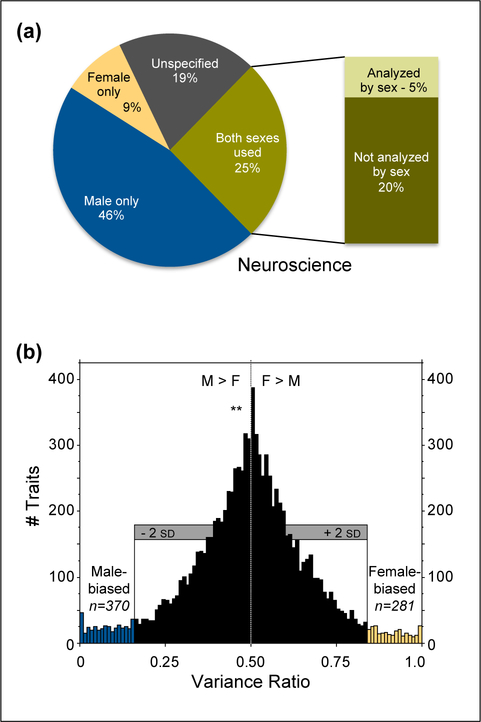
Figure 1.
Data on sex bias and trait variability. A. Inclusion of male and female animal research subjects was surveyed across 10 biological disciplines (neuroscience shown here). Even when both sexes were used, analyses typically did not consider subject sex. Analysis of data from [1]. B. Coefficients of variation were assessed in male and female mice across >9,900 measurements of traits. Variability was similar in males and females, with more male-biased than female-biased traits, and a mean variance ratio significantly lower than 0.5. Modified (with permission) from [22].

