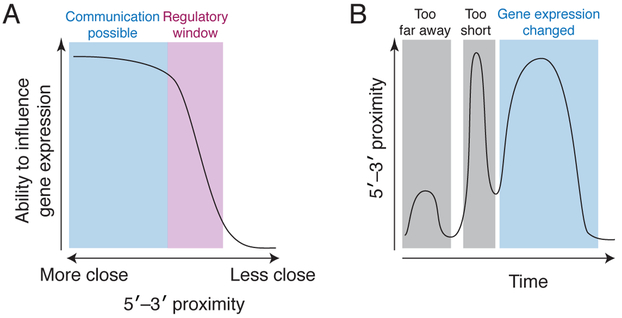
Figure 4. Linking quantitative and temporally resolved studies of 5′–3′ proximity to function.
(A) A hypothetical idealized curve of how the spatial proximity of the 5′–3′ ends of an mRNA results in changes in gene expression. The absolute values associated with communication and the regulatory window remain unknown. In addition, this curve could be different in terms of shape and position for different processes (e.g., translation initiation versus decay), for different mRNAs, or in the presence of different regulatory factors. These effects, combined with dynamic changes in the distance between the 5′–3′ ends, could provide process control of gene expression. (B) This graph depicts a hypothetical example of the 5′–3′ proximity (y-axis) as a function of time (x-axis) on a single mRNA, with the resulting changes in gene expression stated above the graph. In this example, the 5′–3′ ends are initially too far apart to allow communication (left gray box). Then the ends move closer together, but the period of time that they spend close is too short to induce changes in gene expression (middle grey box). It is only when the ends are close enough for a long enough period of time that gene expression changes (cyan box). We lack any quantitative understanding of this relationship, which may vary between different mRNAs, processes, and cellular contexts.

