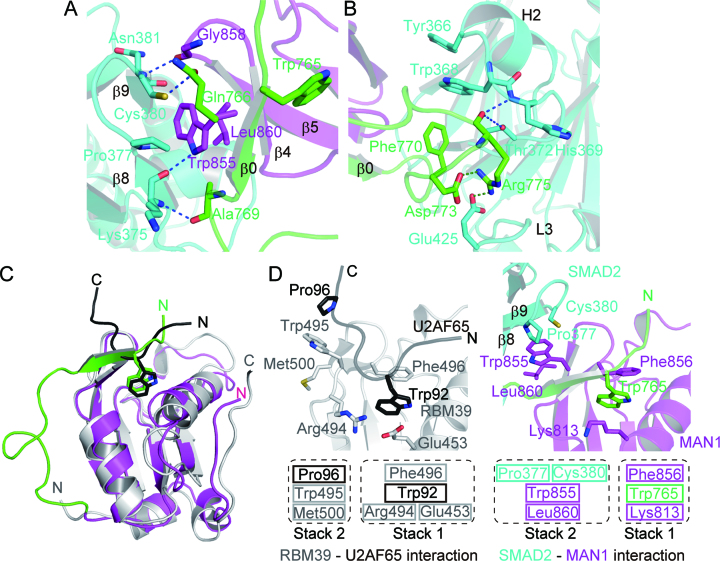
Figure 3.
SMAD2–MAN1 interaction. (A) MAN1 recognition by SMAD2 at strands β8 and β9. SMAD2, the MAN1 ULM and the MAN1 UHM domain are coloured cyan, green and purple, respectively. Hydrogen bonds are shown as blue dotted lines. (B) MAN1 recognition by SMAD2 around the H2 helix and the L3 loop. Salt bridges are shown as green dotted lines. (C) Superposition of the structures of MAN1 and the RBM39 (grey)-U2AF65 (black) complex. Conserved tryptophan residues in ULM are shown as stick models. (D) Structure comparison between the SMAD2–MAN1 complex and the RBM39-U2AF65 complex.

