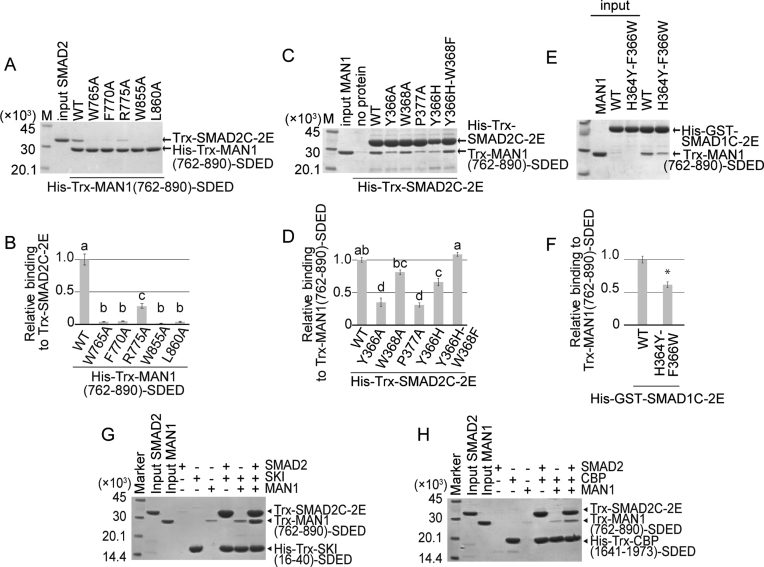
Figure 5.
Binding assay. (A) The electrophoretic pattern of SMAD2 (Trx-SMAD2C-2E) and MAN1 (His-Trx-MAN1(762–890)-SDED and its mutants) after a His-tag pull-down assay. The sizes of the protein markers (lane M) are indicated on the left side of the panel. (B) The relative affinities of the MAN1 mutants. Data are mean ± SEM from triplicate experiments. Bars sharing the same letter are not significantly different (one-way analysis of variance (ANOVA) with Tukey's multiple comparison test, P < 0.05). (C) The electrophoretic pattern of SMAD2 (His-Trx-SMAD2C-2E and its mutants) and MAN1 (Trx-MAN1(762–890)-SDED) after a His-tag pull-down assay. (D) The relative affinities of SMAD2 mutants. Data are mean ± SEM from triplicate experiments. Bars sharing the same letter are not significantly different (one-way ANOVA with Tukey's multiple comparison test, P < 0.05). (E) The electrophoretic pattern of SMAD1 (His-GST-SMAD1C-2E and its mutant) and MAN1 (Trx-MAN1(762–890)-SDED after a His-tag pull-down assay. (F) The relative affinity of a SMAD1 mutant. Data are mean ± SEM from triplicate experiments. *P < 0.05 compared to wild type (WT) by two-tailed Student's t-test. (G, H) Interaction of SMAD2 (Trx-SMAD2C-2E) with MAN1 (Trx-MAN1(762–890)-SDED) and SKI (His-Trx-SKI(16–40)-SDED) (G) or CBP (His-Trx-CBP(1941-1973)-SDED) (H). After the His-tag pull-down assay, the proteins were separated by SDS-PAGE. The gel images are representative of triplicate experiments.

