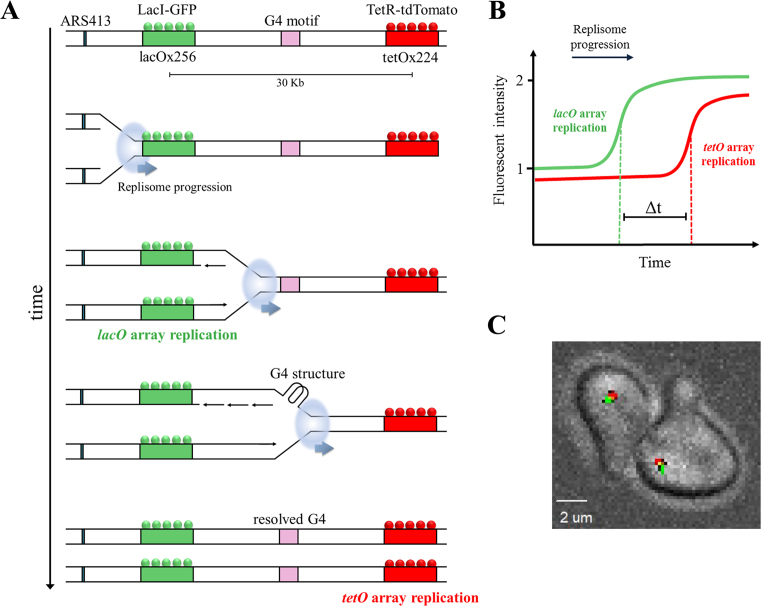
Figure 1.
Measuring replication rates through G-quadruplex (G4) DNA secondary structures in single yeast cells. (A) Schematic illustration of the experimental design for real-time analysis of replication kinetics in live yeast cells. Strains are genetically engineered to contain lacO and tetO arrays adjacent to ARS413, located 20 Kb apart. Binding of lacI-GFP and tetR-tdTomato leads to green and red fluorescent foci, respectively. During DNA replication, array duplication leads to recruitment of additional lacI-GFP and tetR-tdTomato proteins leading to the doubling of fluorescence intensity. Using time-lapse confocal microscopy, the replication time of each locus is measured to calculate the replication rate of the DNA between the two loci. For simplicity, origin firing is shown only to the array direction. To measure replication through G4 structures, these G4 motifs are inserted between the arrays. (B) Schematic display of the increase in fluorescent intensity of the lacI-GFP and tetR-tdTomato foci due to lacO and tetO array duplication during DNA replication. The time delay between arrays replication (Δt) is calculated using the mid-rise points of the GFP and tdTomato fluorescence intensities. Therefore, Δt represents the replication time of ∼30 kb (addition of 10 kb to the 20 kb array spacing). (C) Image of single cells from the yeast strains used in this study.

