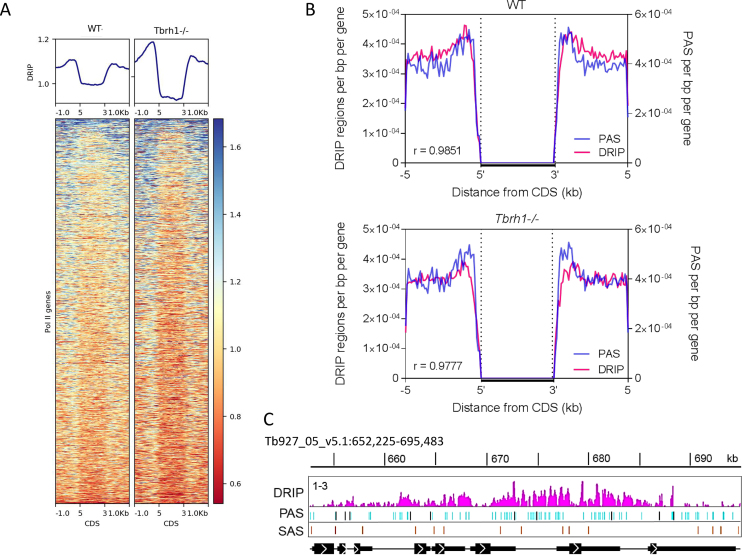
Figure 5.
R-loop accumulation in RNA Pol II transcription units is strongly associated with polyadenylation sites. (A) Metaplots and heatmaps of WT and Tbrh1–/– DRIP signal over the CDS ±1 kb of each Pol II transcribed gene. (B) Metaplots of the number of UTR- or intergenic-associated DRIP enriched regions (red) and PAS (blue) regions per bp for each Pol II CDS ±5 kb for WT (upper) and Tbrh1–/– (lower) DRIP-seq data. (C) Prepresentative screenshot of WT DRIP signal (pink) relative to mapped PAS (blue; predominantly used PAS in dark blue) and SAS (orange) locations in a region of chromosome 5; CDS and DRIP-seq enrichment annotations are as shown as in Figure 1.

