Figure 7.
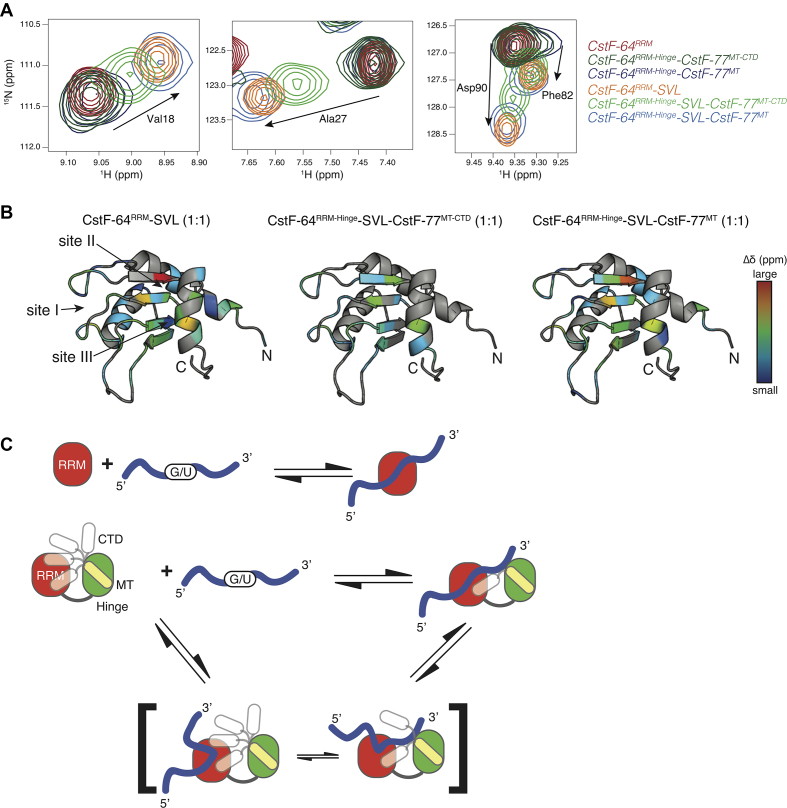
The CTD of CstF-77 perturbs CstF-64RRM-RNA binding. (A) Overlay of 2D 15N-1H HSQC spectra for four different residues experiencing CSPs upon the addition of SVL RNA. Red, dark green and dark blue contours represent the apo form of CstF-64RRM, CstF-64RRM-Hinge-CstF-77MT-CTD and CstF-64RRM-Hinge-CstF-77MT, respectively, whereas the orange, light green and light blue contours represent the 1:1 protein—SVL RNA complexes for CstF-64RRM, CstF-64RRM-Hinge-CstF-77MT-CTD and CstF-64RRM-Hinge-CstF-77MT, respectively. (B) Ribbon diagrams of the CstF-64RRM structure depicting the changes in 15N-1H chemical shift upon titration of SVL RNA into CstF-64RRM (left), CstF-64RRM-Hinge-CstF-77MT-CTD (middle) and CstF-64RRM-Hinge-CstF-77MT (right), respectively. The dark blue-to-red gradient represents backbone amide groups that experience a small-to-large weighted, averaged CSP (0.037–0.24 ppm) (55). Arrows point to the three RNA binding sites (site I, II, III) described by Taylor and co-workers (18). (C) Model of illustrating a possible effect on the CTD of CstF-77 on RNA binding. The top scheme shows the simple two-state model employed by CstF-64RRM and CstF-64RRM-Hinge-CstF-77MT complex. The bottom scheme includes a dynamic complex where the CTD of CstF-77 can adopt multiple conformations, which can occlude binding to sites within the RRM of CstF-64.

