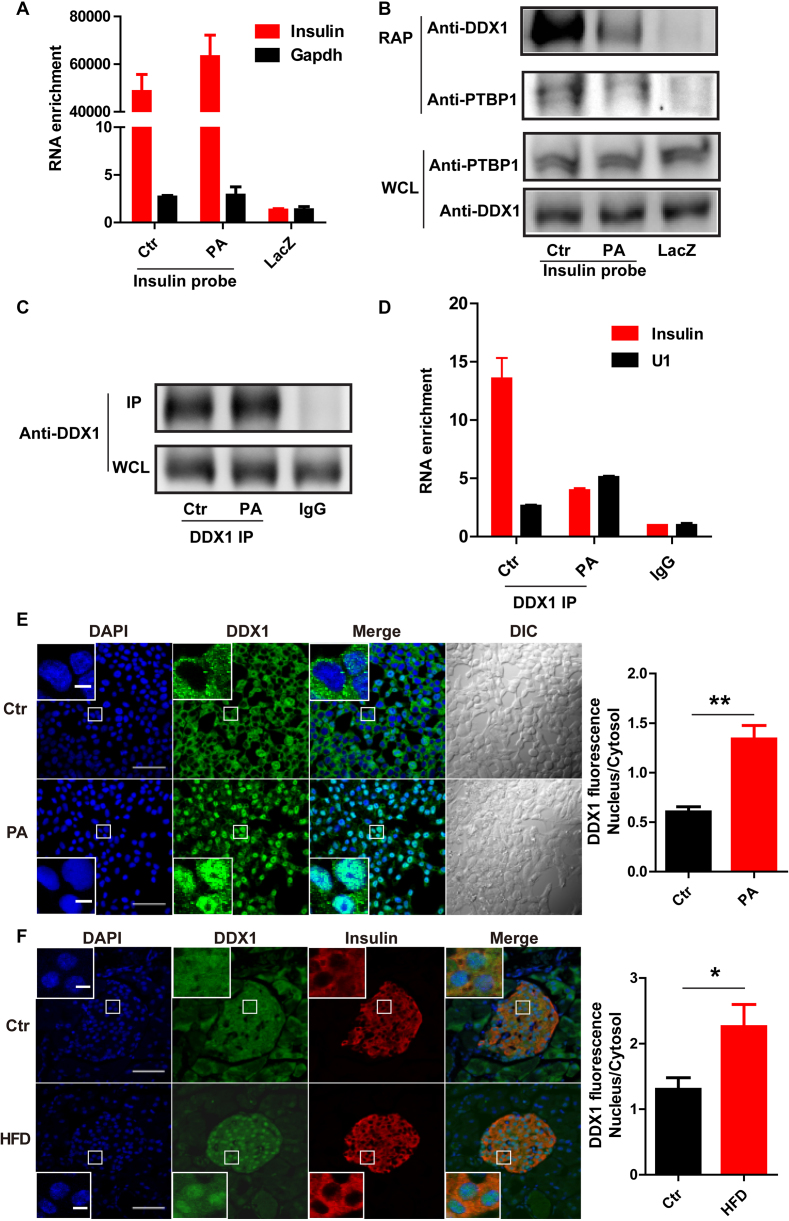
Figure 3.
PA treatment induces the dissociation of DDX1 from insulin mRNA. (A) RT-qPCR was used to determine the enrichment of insulin and Gapdh mRNA levels by binding to insulin antisense probes with and without PA treatment and by binding to LacZ antisense probes as a control. (B) Western blotting was used to determine the levels of DDX1 and PTBP1 pulled down by insulin antisense probes with and without PA treatment and by LacZ antisense probes as a control. (C) Immunoprecipitation (IP) of DDX1 by an anti-DDX1 antibody with and without PA treatment in INS-1 cells. (D) RT-qPCR was used to determine the levels of insulin and Gapdh mRNA co-IPed with a DDX1 antibody in the presence and absence of PA treatment. IgG and U1 snRNA were used as controls. The results are shown as the means ± SEMs (n = 3). (E) Fluorescence staining reflects the nuclear translocation of DDX1 in INS-1 cells with PA treatment. INS-1 cells under normal conditions or PA stimulation were subjected to immunofluorescence with a specific antibody against DDX1 (green). Nuclei were stained with DAPI (blue). Original picture scale bar, 50 μm; enlarged picture scale bar, 5 μm. The average fluorescence intensity of the nucleus was divided by that of the cytosol; the ratio was markedly increased by PA treatment (right panel). The results are shown as the means ± SEMs (n = 3). Significance was determined by a two-tailed unpaired t-test; **P < 0.01. (F) Fluorescence staining reflects the nuclear translocation of DDX1 in pancreatic islets of HFD mice. C57BL/6N mice were fed a regular chow diet (Ctr) or a high-fat diet (HFD) for 1 week (n/n = 4/4). The pancreas was isolated and embedded in paraffin. The paraffin sections were dewaxed and subjected to antigen retrieval followed by immunostaining with specific antibodies against DDX1 (green) and insulin (red). Nuclei was stained with DAPI (blue). Original picture scale bar, 50 μm; enlarged picture scale bar, 5 μm. The results are shown as the means ± SEMs (n = 4 animals per treatment). Significance was determined by a two-tailed unpaired t-test; *P < 0.05.

