Figure 6.
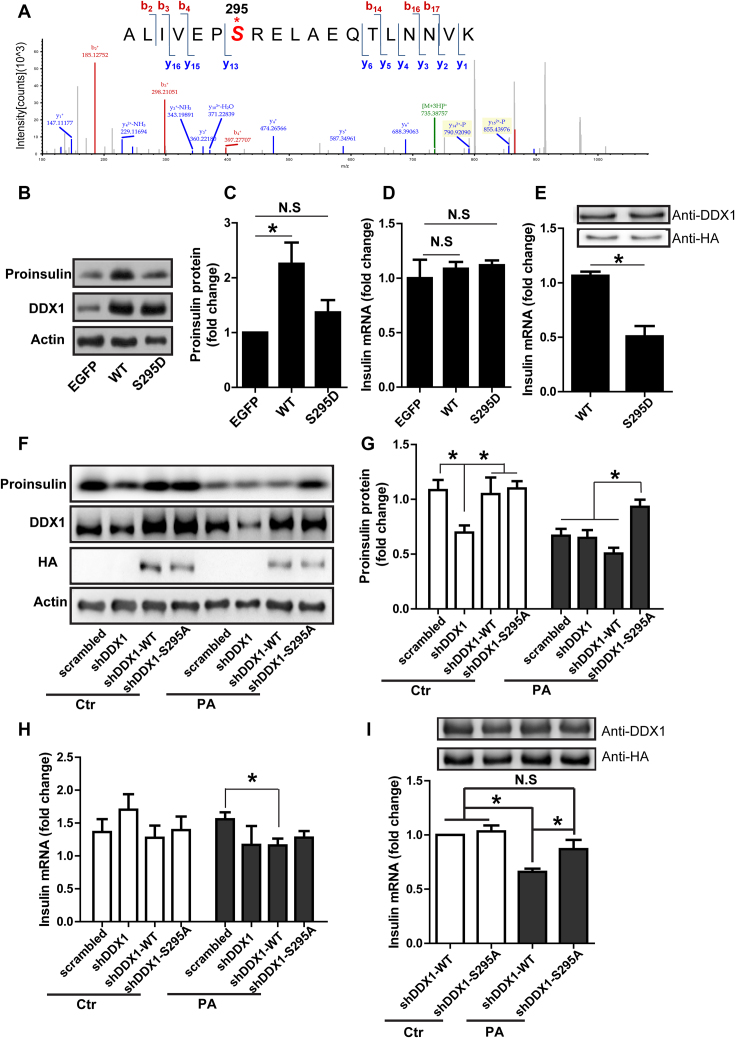
The PA-induced phosphorylation of DDX1 at S295 is responsible for insulin translation repression. (A) The mass spectra showing DDX1 phosphorylation at S295 after PA stimulation. (B–D) Western blotting was used to determine proinsulin expression in shDDX1 cells overexpressing WT or S295D-mutant DDX1 (B). Proinsulin expression was normalized to actin expression (C). RT-qPCR was used to determine the insulin mRNA level in shDDX1 cells overexpressing WT or S295D-mutant DDX1 (D) (n = 7). (E) RIP-PCR was used to determine the amount of insulin mRNA pulled down by HA-DDX1 (WT) or HA-DDX1 (S295D) (n = 4). (F-H) Western blotting was used to determine proinsulin expression in shDDX1 cells overexpressing WT or S295A-mutant DDX1 with or without PA treatment (F). Proinsulin expression was normalized to actin expression (G). RT-qPCR was used to determine the insulin mRNA level in shDDX1 cells overexpressing WT or S295A-mutant DDX1 with or without PA treatment (H) (n = 3). (I) RIP-PCR was used to determine the amount of insulin mRNA pulled down by HA-DDX1 (WT) or HA-DDX1 (S295A) with or without PA treatment (n = 3). The results are shown as the means ± SEMs. Significance was determined by a two-tailed unpaired t-test; *P < 0.05; N.S., no significance.

