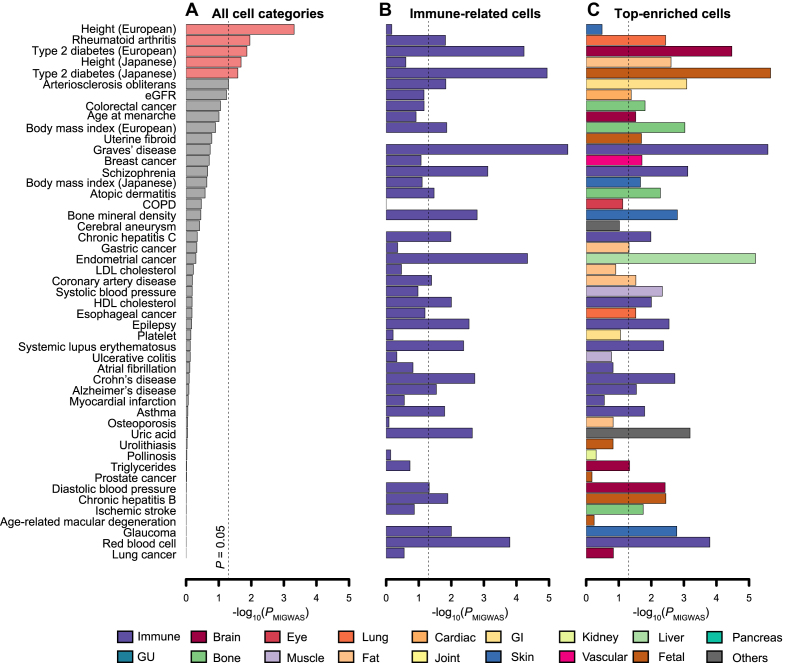
Figure 2.
MIGWAS results of the GWASs on 49 complex human traits. An enrichment signal is shown by -log10(PMIGWAS). (A) Overall polygenic contribution of miRNA–target gene network to the traits through the tissue-naïve approach. Traits that have bars colored with pink showed nominally significant enrichment (PMIGWAS < 0.05). (B) An example of tissue-specific enrichment signals focusing on immune-related cells. A bar in each trait represents an enrichment signal of the most significant immune-related cell. (C) An enrichment signal in the strongest associated cell of each trait. The tissue category of the cell is shown by the color of the bars. Detailed descriptions on cell types and their categories are available at Supplementary Table S1. GI; gastrointestinal, GU; genitourinary.

