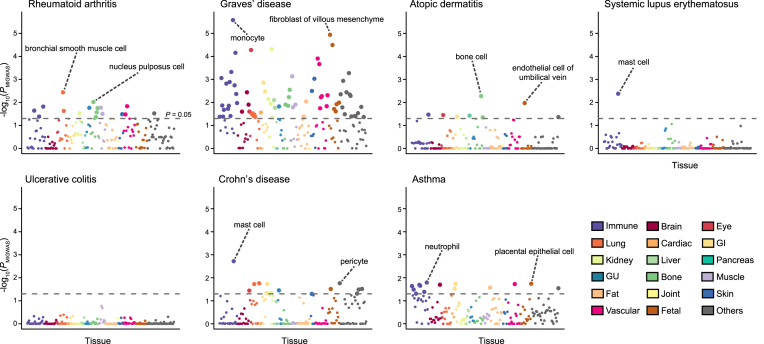
Figure 3.
Tissue-specific enrichment signal of miRNA–target gene network in selected immune/allergy- related traits. Each circle represents the cell-specific enrichment signal in –log10(PMIGWAS), colored with tissue categories. Large circles pass the nominal threshold of enrichment P value < 0.05, which was indicated as dotted lines. The names of top 2 enriched cells that passed the threshold are also shown. Detailed descriptions on cell types and their categories are available at Supplementary Table S1. GI; gastrointestinal, GU; genitourinary.

