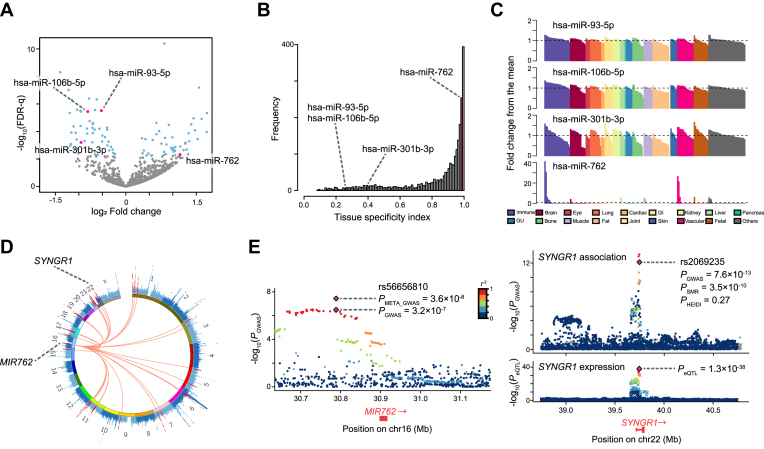
Figure 4.
Results of differentially expressed miRNA analysis between RA patients and healthy controls. (A) Volcano plot displaying differentially expressed miRNAs between RA and healthy controls. The x-axis corresponds to the log2 fold change value and the y-axis corresponds to –log10(FDR-q). The blue dots represent the differentially expressed miRNAs (FDR-q < 0.05). The pink dots represent differentially expressed miRNAs that overlapped with those identified in MIGWAS analysis. (B) The distribution of tissue specificity index (TSI) among all the miRNAs in expression data by FANTOM5. Bars colored with pink show the bins which the overlapped candidate miRNAs belong to. (C) Quantile-normalized expression values of the overlapped miRNAs in 179 cell types (x-axis), scaled as fold changes of the expression levels from the mean levels among all the cell types (y-axis). Bar colors represent the tissue into which each cell is categorized. GI; gastrointestinal, GU; genitourinary. (D) CIRCOS plot that shows a Manhattan plot of the RA GWAS marked by MIR762 and its target genes in red. (E) Regional plots of the RA GWAS illustrating variants neighboring MIR762 (left) and SYNGR1 (right top). Diamonds represent the leading variants, and also shown are their identifiers, linkage disequilibrium structure and association statistics. Two diamonds in the left panel represent the P value of rs2069235 from the original RA GWAS summary statistics (PGWAS) (21) and one from the new meta-analysis described in this paper (PMETA_GWAS). Right bottom, eQTL P values from CAGE dataset for a probe tagging SYNGR1.

