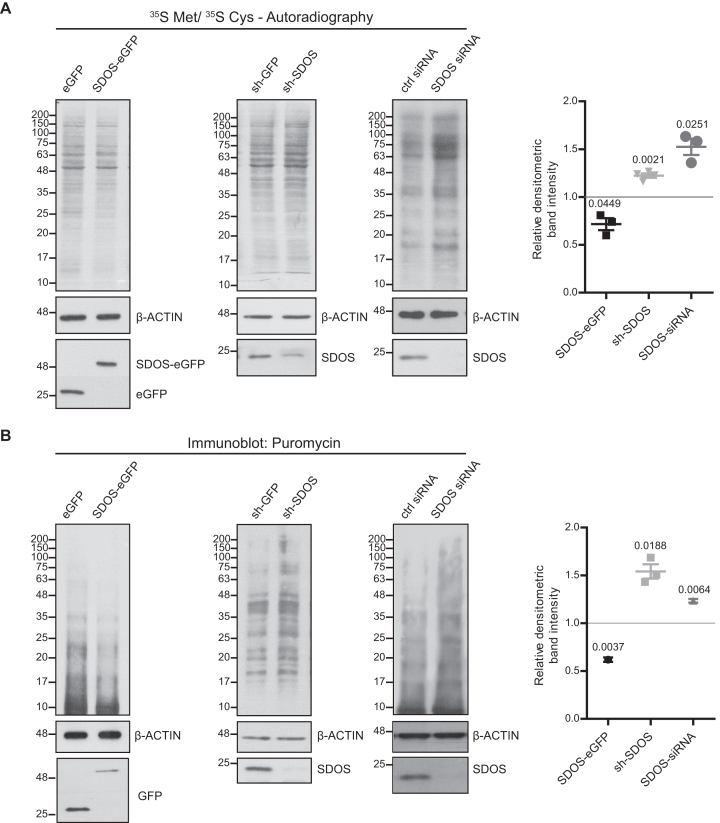
Figure 3.
SDOS overexpression represses translation of specific mRNAs. (A) Autoradiography of total lysates from cells labeled with 35S Met/35S Cys (left) and relative densitometric band intensities (right), calculated by assuming protein levels of the control equal 1, following 24 h induction of eGFP/SDOS-eGFP or 48 h of shGFP/shSDOS in Hela FITR or transfection of SDOS-targeting siRNA and non-targeting control siRNA in HCT116 cells. The P-value in the graph indicate the statistical significance based on one-sample t-test (n = 3). (B) WB analysis of total lysates following puromycin treatment (1 μg/ml, 15 min) (left) and relative densitometric band intensities (right), calculated by assuming protein levels of the control equal 1. The P-value in the graph indicate the statistical significance based on one-sample t-test (n = 3).

