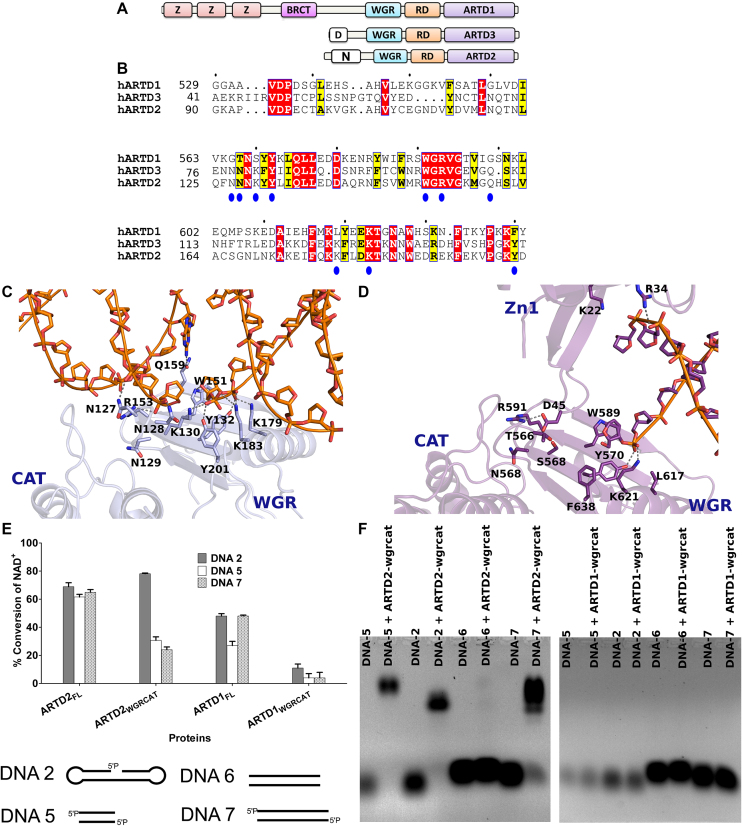
Figure 3.
Schematic, sequence alignment and structural/functional comparison of ARTD1 and ARTD2. (A) Domain organization of DNA dependent ARTDs. (B) Protein sequence alignment of ARTD1WGR, ARTD2WGR and ARTD3WGR. Identical residues are highlighted in red and similar residues in yellow. (C) Structural representation of ARTD2WGR bound to DNA break with 5′-phosphate (blue). The catalytic domain (CAT) (PDB ID 4PJV) was positioned based on ARTD1 structure seen in panel D. (D) Structural representation of ARTD1 bound to DNA break (purple) (PDB ID 4DQY). WGR, C-terminal catalytic domain (CAT) and Zinc finger (Zn1) are labelled. The superimposed model of ARTD1 and ARTD2 is shown in Supplementary Figure S11. (E) The specific DNA dependent activity of ARTD2FL, ARTD2WGR+CAT, ARTD1FL, ARTD1WGR+CAT were measured using fluorescence activity assay as described in the materials and methods. ARTD2FL at 50 nM was incubated for 1 h, ARTD2WGR+CAT and ARTD1WGR+CAT at 50 nM were incubated for 2 h, and ARTD1FL at 25 nM was incubated for 2 h. The NAD+ concentration in all the experiments was 5 μM. Data are presented as means and standard deviation of the quadruplicates. (F) The interaction of ARTD2WGR+CAT and ARTD1WGR+CAT with DNA were studied using EMSA.

