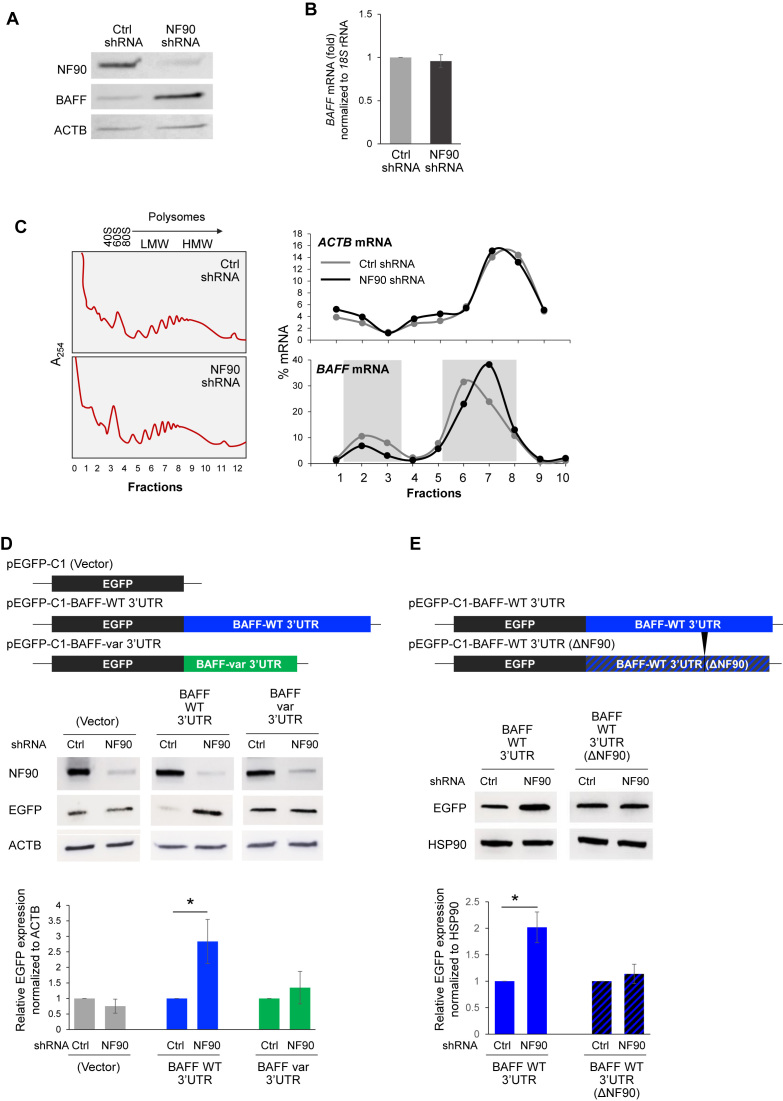
Figure 3.
NF90 represses BAFF translation. (A, B) Western blot analysis (A) and BAFF mRNA (B) produced by THP-1 cell populations with stably reduced NF90 levels (NF90 shRNA) and control cells (Ctrl shRNA). (C) The relative distribution of BAFF mRNA (and ACTB mRNA, encoding the housekeeping protein β-Actin) in polysomes prepared from the THP-1 populations described in (A) was assessed by RT-qPCR analysis as described in Figure 1D. Shaded rectangles highlight the rightward shift in the distribution of BAFF mRNA in sucrose gradients in the NF90 shRNA group compared to the Ctrl shRNA group. (D) Schematic of the EGFP reporter constructs bearing the BAFF-WT 3′UTR, the BAFF-var 3′UTR, or no 3′UTR (Vector) used for reporter analysis. Twenty-four hours after transfecting the THP-1 cells described in panel (A) with each EGFP vector, EGFP expression levels were assessed by western blot analysis (top). EGFP signals from three experiments were analyzed using imageJ and plotted relative to Ctrl shRNA in each transfection group (bottom). (E) Schematic of EGFP reporter constructs bearing the BAFF-WT 3′UTR, or the BAFF-WT 3′UTR(ΔNF90) 3′UTR. Twenty-four hours after transfecting THP-1 cells as described in (A) with each vector, EGFP expression levels were assessed by western blot analysis. EGFP signals from three experiments were quantified using imageJ and plotted relative to Ctrl shRNA in each transfection group. Data in (B, D, E) are the means and SEM from at least 3 independent experiments (*P < 0.05; significance was determined by Student's t-test).

