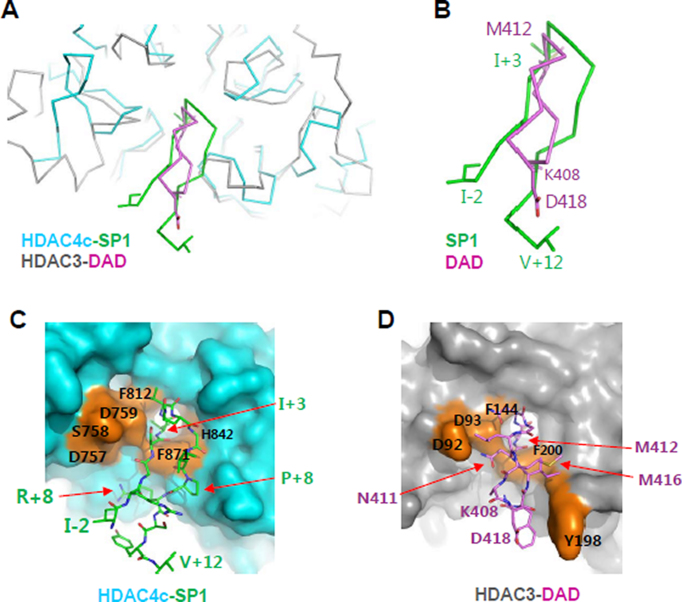
Figure 6.
A structural comparison of the HDAC4-SP1 complex with the HDAC3-SMRT DAD complex. (A) Superposition of HDAC4-SP1 complex structure with HDAC3-SMRT DAD structure (PDB ID 4a69). Only the N-terminal head (K408-D418) of the SMRT DAD was displayed for clarity. Two compared structures were superposed and drawn with Cα tracings in alternative colors. Some residues were displayed with stick models. (B) A closed-up view of SP1 and DAD β-hairpins. Terminal residues and the key I+3 and M412 residues at the turns of two β-hairpins were displayed with sticks and labeled with different colors. (C) Structure of HDAC4c cleft bound with SP1 β-hairpin. HDAC4c was displayed with a surface presentation (cyan) and SP1 peptide was drawn with stick models (green). Some SP1-interacting HDAC4 residues were indicated on the surface in orange color. (D) Structure of HDAC3 cleft in complex with DAD β-hairpin. HDAC3 was displayed with a surface presentation (gray), and the N-terminal β-hairpin of SMRT DAD was drawn with stick models (magenta). HDAC3 residues that interact with the DAD β-hairpin were indicated on an orange-colored surface.

