Figure 5.
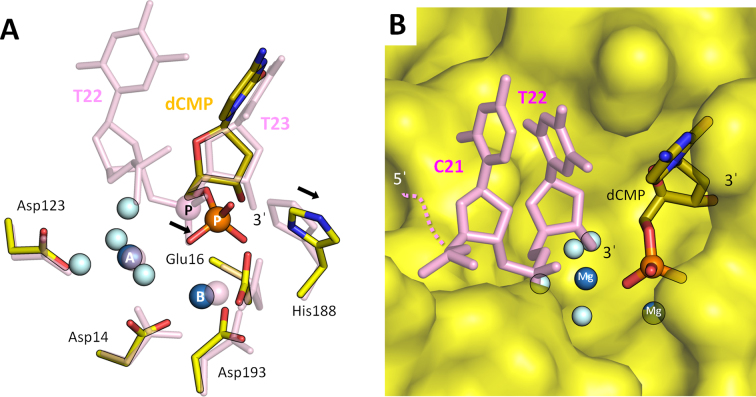
Active site structure of mTREX2–product complex. (A) The superposition of the two active sites in mTREX2–substrate complex (mTREX2-Y-shaped DNA complex) and mTREX2–product complex. The substrate complex is colored pink. The scissile phosphates are displayed as pink or orange balls and labeled ‘P’. The water molecules and two Mg2+ are displayed as light blue and blue balls, respectively. (B) Structural model of the transition state is between substrate cleaving and product releasing. mTREX2 protein is displayed as surface mode.

